Alabama Learning Exchange
Keep It Movin'!
Learners conduct an experiment to study friction. They complete a KWL chart on friction and conduct an activity about the amount of friction on a moving object. To conclude, pupils create a table or graph of the data collected and they...
Curated OER
How Does a Seed Grow Into a Plant?
Second graders explore how seeds grow into plants. They discuss types of seeds and place seeds in wet paper towels to germinate. They draw a picture in their journal to record their observations for four days. They take pictures of their...
Curated OER
Jelly Belly: What a Wonderful "Bean"!
Students explore how jelly beans are produced. They discuss the origins of the jelly bean and view a video about how jelly beans are prepared, tested, shaped, finished, and shipped and estimate the amount of jelly beans in a jar and sort...
Curated OER
Positive Future Fair Project
Ninth graders view the film "Pay It Forward" and discuss what kind of public campaign is needed to move people to positive action. They consider different ways of presenting information (graphs, visual displays, etc.) as tools for...
Curated OER
Keep It Cool
Students complete a science experiment to study insulation, heat transfer, and permafrost. In this permafrost study instructional activity, students design and test a soda insulator. Students graph their class data and discuss the...
Curated OER
Making a Map
Students are introduced to maps by examining the various types and practice using a key to find information. They each create their own map with a key and graph information. As a class, they read the story "Henny Penny" and share their...
Curated OER
Grab Bag Experiment
Students analyze and record data. For this lesson about graphing and gathering data, students learn about the step of an experiment. Students learn new vocabulary, sort beans, record the data, and graph the data. Students add a variable...
Curated OER
A Country’s Shape Is More Than Its Borders
In this geography skills worksheet, learners read an article and examine graphs about population prior to answering 13 short answer questions and 10 multiple choice questions. Students then respond to the writing prompt about population.
Curated OER
Families
Students draw a picture of their families and discuss how each is different. In this families lesson plan, students discuss how each family is uniquely different and special in their own way.
Curated OER
Sleep Central
First graders explore healthy and unhealthy sleeping habits. They make a class graph of the total number of hours students, as a class, sleep for the week.
Curated OER
Car Maze competition
Young scholars use graphs to calibrate an RCX car. They must then program the car to traverse a maze using their calibrations
Curated OER
How Far Will It Roll?
Learners construct a car with the longest roll using a ramp. They construct Lego cars, modify the wheel sizes and car configurations to evaluate which car design rolls the longest distance, develop a graph, and complete a worksheet.
Curated OER
Catching Some Rays
Sixth graders explore the tilt of Earth's axis. In this Earth lesson plan, 6th graders read a Greek mythology story explaining why there are seasons. Students build a sun-ray gathering tool from styrofoam, glue, thermometers, skewers,...
Curated OER
Picture a Nation
Young scholars research immigration data from a specific time period. They create a graphic organizer that depicts the information and share the information with the class.
Curated OER
Crime School Investigations
Students solve a mystery at their school. In this classifying lesson, students find suspects who committed the crime. Students categorize them into race, sex, and fingerprint type. Students show their results in graphs.
Curated OER
Worksheet 16 - Spring 1996
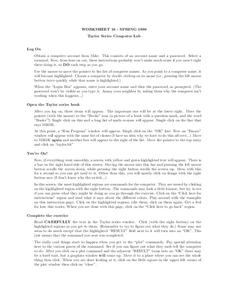
In this math activity, students read the instructions for setting up a computer program. Then they practice graphing the functions with the software program.
Curated OER
Give it Back from a Snack
Students conduct and analyze a survey about snacks. In this graphing lesson, students ascertain which snacks would be the best choice for the community. Students hold a sale and decide how the money could best be spent for the school...
Curated OER
Tally Time
Students create a tally chart. In this math and health lesson, students discuss healthy foods and create a tally chart showing the number of students who like to eat healthy foods.
Curated OER
Bird Feeding and Migration Observation
Students research bird migration and build a bird house. In this bird lesson plan, students research the birds in their area and where they migrate to. They also build their own bird house and record data on what kinds of birds come to...
Curated OER
Do Not Open Until May 2000!
Students create a time capsule. In this time capsule instructional activity, students collect and record data about themselves to be stored in a time capsule that will be opened at the end of the year.
Curated OER
Favorite Christmas Carols
Third graders take a survey of friends' and family members' favorite Christmas carols. They illustrate a favorite Christmas carol and have students try to guess the name of the carol based on the picture.
Curated OER
How's the Weather
"How's the Weather?" is an exercise that combines science and math as students graph the weather along the Iditarod Trail. They complete a double-line graph of the weather of a chosen checkpoint over the course of one week. Students...
Curated OER
It Takes All Kinds!
Students view video clips and observe similarities and differences between animals. They sort animals into groups for a zoo. They make a graph of their observations and review scientific classifications.
Curated OER
Research Project
Learners poll the class regarding their favorite pet and then research that pet using Internet research. They create reports including pictures made on KidPix.


