Curated OER
Dynamite Data
Second graders rotate through a variety of stations designed to offer practice in manipulating data. They sort, tally and count items and then create bar graphs, tables, and pie graphs to record their findings.
Curated OER
Pumpkin Seed Data!
Second graders work with pumpkins to estimate, then accumulate data about pumpkin seeds. After cleaning out the pumpkins, 2nd graders utilize a worksheet imbedded in this plan which has a variety of pumpkin math activities they can do.
Curated OER
Where Did the Bunny Leave the Eggs? Picture Graphing Activity
The Easter Bunny left us a bunch of eggs, but how many did he leave? Learners use the data to create a picture graph, interpret it, and answer the questions that follow. There's even easy egg cut-outs for your youngsters!
National Security Agency
Line Plots: Frogs in Flight
Have a hopping good time teaching your class how to collect and graph data with this fun activity-based lesson series. Using the provided data taken from a frog jumping contest, children first work together creating a line plot of the...
Curated OER
Using Pictographs With Data
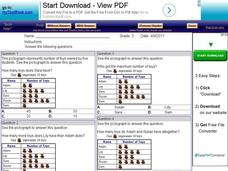
For this using pictographs with data worksheet, 3rd graders read data from a pictograph to answer ten multiple choice questions. Answers can be shown on the screen.
Curated OER
Can You Count on Cans?
How can a canned food drive be connected to math? It's as simple as counting and organizing the cans! Children demonstrate their ability to sort non-perishable foods into categories that include soup cans, vegetable cans, boxed items,...
Curated OER
All in the Family
Learners use data to make a tally chart and a line plot. They find the maximum, minimum, range, median, and mode of the data. Following the video portion of the lesson, students will visit a Web site to test their data collection skills...
Curated OER
Picture Graphs
An innovative way to practice reading data, as well as the four operations! Three picture graphs prompt first graders to count marbles, books, and pets. They also solve addition and subtraction problems. Additionally, they work on...
Worksheet Web
Using Pictographs
If one ice cream cone represents three ice cream scoops, and Bob has four ice cream cones, then how many scoops does Bob have? Learners solve these kind of questions with their new understanding of pictographs.
Curated OER
A Day at the Beach
Let's go to the beach! Danielle, Marty, and Phil collected shells at the beach. Can you determine how many shells each child has? Create a picture graph to make the data easier to understand.
Curated OER
School Activities
First graders place some specific types of objects (e.g., shoes, favorite food) on concrete graphs and pictographs. They listen and respond to others in a variety of contexts (e.g., pay attention to the speaker; take turns speaking in a...
Curated OER
Graphing Data
Second graders graph data about their classmates. For this data analysis lesson, 2nd graders ask each other several questions about their hair color and eye color. Students graph the data that they collected.
Curated OER
Comparing School Bus Stats
Engage in a lesson that is about the use of statistics to examine the number of school buses used in particular states. They perform the research and record the data on the appropriate type of graph. Then they solve related word problems.
Curated OER
Data Handling: Pictogram of Birds
In this pictograph problem solving worksheet, students analyze a pictograph of birds seen each day for a week. They use the information on the graph to solve 6 problems.
Curated OER
Gummy Bear Picture Graph
First graders investigate picture graphs. In this graphing instructional activity, 1st graders create a picture graph with the x-axis being number and the y-axis being color. Students sort their gummy bears by color and use pictures of...
Curated OER
The Egg Hunt- Using a Graph to Answer Data Questions
In this pictograph instructional activity, learners answer questions based on a pictograph that shows colored Easter eggs. They follow the key that shows that each egg picture is equal to 10 eggs. They fill in the blanks with answers to...
Curated OER
Questionnaires and Analysis
Students, review the techniques and different types of data analysis as well as how they are expressed, identify why facts and data are needed in conclusion of a questionnaire. The concepts of qualitative and quantitative data are...
Curated OER
Data Collection and Presentation
Students concentrate on discrete quantiative data. They are shown that the vertical line diagram as a more appropriate way to present discrete quantiative data then bar charts. Students work as a group to help with the interpretation...
Curated OER
Analyzing Graphs and Data
Students collect and analyze data. In this statistics instructional activity, students graph their data and make inferences from the collected data. They display their data using graphs, bar graphs, circles graphs and Venn diagrams.
Curated OER
WHAT IS THE POPULAR COLOR?
Fourth graders graph cars according to their colors. They complete the graph including a title, scale, x-axis, and y-axis. Students collect the data and choose the type of graph to be made.
Alabama Learning Exchange
Tiger Math Graphing
Learners practice various skills using the book Tiger Math: Learning to Graph from a Baby Tiger. After listening to the story, they create a pictograph using data collected from the text. They also color a picture of a tiger, collect...
Curated OER
Reading the Neighborhood
First graders complete activities with the story One Monday Morning in the Macmillan/McGraw Hill Textbook. In this data lesson, 1st graders read the story and gather data to create a picture graph. They read the graph and answer...
Alabama Learning Exchange
Poppin' For Popcorn!
Students graph data from different popcorn flavors. In this graphing lesson, students make graphs using an assigned web site after collecting data about the flavors of popcorn that fellow classmates prefer.
Curated OER
If Our Class Went to See the Prince
First graders read the story One Monday Morning and create picture graphs based on the number of teachers, boys, and girls that would visit the prince. In this data lesson plan, 1st graders interpret tables and graphs with the help of...


