Curated OER
Using Riemann Sums
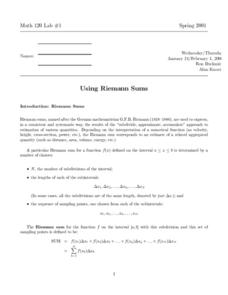
In the Riemann sums worksheet, students use Riemann sums to estimate the area under a curve. They calculate intervals and subintervals. Students create a graph picturing the intervals. This seven-page worksheet contains explanations...
Curated OER
Making a Pictograph
In this pictograph worksheet, students use a picture to make a pictograph, then solve 2 related problems. Students also complete a "Test Prep" question about the graph.
Curated OER
Speed II Problems
In this higher-level math worksheet, students complete 10 problems involving speed, distance, time, and length using graphs and pictures. An excellent worksheet with easy-to-understand graphics and problems.
Curated OER
Breeding Bird Atlas Activity
In this breeding birds worksheet, students read a passage about birds and the Breeding Birds Atlas, then answer a set of comprehension questions based on graphs, maps and pictures given. Questions have multiple components.
Curated OER
Worksheet 32 - Fall 1995
In this math worksheet, students find the area enclosed by the parabola’s arch and the x-axis. They are asked about the highest point of the parabola in terms of a.
Curated OER
Frequency Table
In this frequency table worksheet, students create a frequency table from given data. They identify the mode. Students read and interpret frequency tables. This one-page worksheet contains 7 multi-step problems.
Curated OER
Line Plots
In this line plot worksheet, students create a line plot of given data. They identify the range, clusters, gaps, and outliers. This one-page worksheet contains 8 multi-step problems.
Curated OER
MT-A141 PreCalculus: Worksheet 6.2/6.3
In this precalculus worksheet, students use their graphing calculator to determine the coordinates for given functions. They determine the values for cosine, sign, tangent, and secant of given equations. Given an angle of elevation,...
Curated OER
Math And Reading
In this math and Language Arts worksheet, learners mark the vowel sound they hear for each picture and write a sentence about a picture. Students also use a graph to answer three questions.
Curated OER
Constellations
In this constellations instructional activity, students write their name as a constellation using an x and y-axis graph. This instructional activity has 1 graph to create.
Curated OER
Monkey Mayhem
In this sorting and categorizing instructional activity, students take complete a graphing experiment using monkeys in a bag. Students graph their results on the piece of paper.
Curated OER
Misleading Statistics
In this statistics activity, 6th graders solve and complete 2 different problems. First, they use the graphs shown to determine the number of hours. Then, students use the graphs at the bottom to determine the profits gained over a...
Curated OER
How to Take math Lectures Notes
For this math worksheet, students review the steps they were taught, to take correct notes in their math class. This worksheet can be used to teach students the correct process of note taking for just about any subject. There are 6...
Kelly's Kindergarten
June Daily Activities
This is an absolute must-have resource for early elementary teachers! Here you'll find a collection of activities and worksheets for each day of the month of June, with topics ranging from ordering numbers on a calendar or identifying...
University of North Texas
Math Exam 1 Review
Perfect as a review guide, this activity provides a range of questions focusing on functions. Topics include composing functions, transformations, domains, and polynomials. Also included are corresponding worksheets focusing on other...
Curated OER
Shaquille O'Neal Hand/Foot Span: Student Worksheet
Here's a clever math worksheet that has learners measure their hand span, foot length, come up with a ration, then use that information to figure out the hand span, and foot length of basketball giant Shaquille O'Neal. A good activity!
Curated OER
Third Grade Science
In this science worksheet, 3rd graders answer multiple choice questions about measurement, plants, water, fossils, and more. Students complete 25 questions.
Noyce Foundation
Time to Get Clean
It's assessment time! Determine your young mathematicians' understanding of elapsed time with this brief, five-question quiz.
Noyce Foundation
Pizza Crusts
Enough stuffed crust to go around. Pupils calculate the area and perimeter of a variety of pizza shapes, including rectangular and circular. Individuals design rectangular pizzas with a given area to maximize the amount of crust and do...
Inside Mathematics
Snakes
Get a line on the snakes. The assessment task requires the class to determine the species of unknown snakes based upon collected data. Individuals analyze two scatter plots and determine the most likely species for five additional data...
Computer Science Unplugged
Colour by Numbers–Image Representation
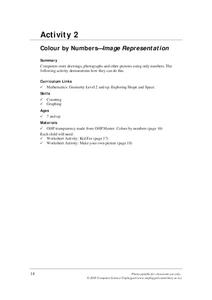
How do computers store and send images? Here's an activity that explains one way a computer can compress image information. Pupils decode run-length coding to produce a black and white image. Pairs then work together to code and decode...
Cherry Creek Schools
Physical Science Final Exam Review Packet
If you need a way to assess the concepts in your physical science class, use an extended set of worksheets as a midterm or final exam. It includes questions about density, physical and chemical matter, speed and velocity, weight and...
Inside Mathematics
Conference Tables
Pupils analyze a pattern of conference tables to determine the number of tables needed and the number of people that can be seated for a given size. Individuals develop general formulas for the two growing number patterns and use them to...
California Education Partners
Least and Greatest
Squares can be magic. Pupils use their knowledge of addition of positive and negative rational numbers to create a 3 X 3 magic square where the sums are 1. Scholars create addition and multiplication expressions with a set of rational...
Other popular searches
- Coordinate Picture Graphs
- Christmas Picture Graphs
- M&m Picture Graphs
- Hidden Picture Math Graphs
- Picture Graphs Worksheets
- Math Lessons Picture Graphs
- 5th Grade Picture Graphs
- Bar and Picture Graphs
- Thanksgiving Picture Graphs
- Circle and Picture Graphs
- Picture Graphs Template
- Reading Picture Graphs


