Curated OER
The First Strawberries
Young scholars explore Cherokee legends. They read The First Strawberries by Joseph Bruchac, and then do several activities to help comprehension. They discuss the book and answer comprehension questions. In addition, they retell the...
Curated OER
Practice Estimating!
Bring math home with this interative estimating worksheet! Scholars make educated guesses about the number of six household items: crayons in a crayon box, keys on a key ring, coins in a piggy bank, trees in the yard, pictures on the...
Curated OER
Scatterplots and Regressions
In this scatterplots and regressions worksheet, students solve 6 different types of problems related to graphing scatterplots and interpreting regressions. First, they create a scatterplot from the given data coordinates and then,...
Curated OER
Ice Cream Pictograph
Students create a graph. In this pictograph lesson plan, students cut out 20 small ice cream cones and decorate them. Students create a pictograph with their ice cream cones.
Curated OER
Boots
In this graphing practice worksheet, 5th graders plot squares on a graph with an x and y axis. Once students locate each square they must color a certain design in that box to create a larger picture.
Curated OER
The Square Counting Shortcut
An excellent lesson that encourages students to discover how complex figures can be broken into simpler shapes when measuring area. Working with block letters, learners are given the freedom to develop their own strategies for...
Curated OER
Congruent Rectangles
Very simply, geometers examine a pair of rectangles on graph paper and find a translation and rotation to demonstrate their congruence. A couple of questions follow to stimulate critical thinking about other possibilities.
National History Day
Propaganda Posters of World War I: Analyzing the Methods Behind the Images
The power of a picture. During the events surrounding World War I, propaganda posters were widely distributed in American society to sway the emotions of its citizens. By analyzing World War I propaganda posters in the first installment...
Curated OER
Creating Stories Using Pictographs
Fourth graders research pictograph stories written by Native Americans. They investigate the history behind pictographs, and look through a reference book identifying the different pictures. The teacher then create their own individual...
Curated OER
Pictures of Data
In this data worksheet, students look at maps and charts and answer multiple choice questions about them. Students complete 10 questions.
Beyond Benign
Decision Graphic Introduction
E is for economics, environment, and social equity. The fifth installment of a 15-part series has scholars first considering ecological impacts, such as determining how much water it takes to produce a can of soda. They then use decision...
Radford University
Skate Ramp
Going up and down makes a more exciting ride. Pupils recall what they know about continuity and limits of functions. Working in groups, classmates design a skateboard ramp that meets a given set of criteria, using at least three...
Living Rainforest
Finding the Rainforests
From Brazil to Indonesia, young scientists investigate the geography and climate of the world's tropical rain forests with this collection of worksheets.
Curated OER
Will It Sink or Float?
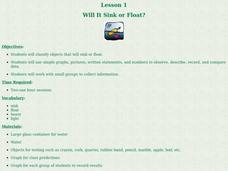
Students perform experiments to see if items will sink or float. In this sink or float lesson, students work in groups to make predictions, and record the results. After the experiments are complete students make a book of the results.
Curated OER
Who Took the Cookies
Students find the missing cookies. In this language arts lesson, students solve the mystery of who is taking the cookies from the cookie jar. Students are read several books with the same mystery of cookies being taken from the jar.
Curated OER
Grid Skills
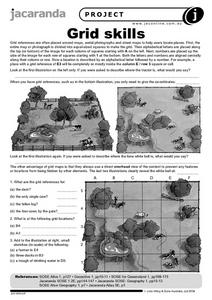
In this geography activity, students use grid references on a map to locate places in the pictures given. They also identify another advantage of using a grid map, which they have an overhead view of the content to prevent any features...
Curated OER
Mathematics Lesson Plan
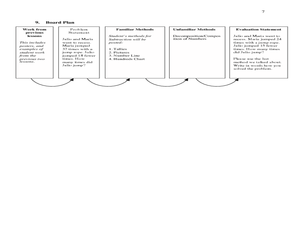
Second graders study subtraction facts. In this mathematics instructional activity, 2nd graders discuss how to solve two digit subtraction problems. Students recognize that there are many different methods or strategies one can use such...
K12 Reader
Displaying Data
It's important to learn how to display data to make the information easier for people to understand. A reading activity prompts kids to use context clues to answer five comprehension questions after reading several paragraphs about...
Cornell University
Math Is Malleable?
Learn about polymers while playing with shrinky dinks. Young scholars create a shrinky dink design, bake it, and then record the area, volume, and thickness over time. They model the data using a graph and highlight the key features of...
Curated OER
If the World Were a Village...
Your class members explore concept that the world is a large place, examine how statistics can be used to help in understanding the world and its people, and create illustrations or graphs of statistics found in the award-winning...
Curated OER
How Are Stars Like People?
A beautifully written lesson plan delves into a beautiful topic: stellar population. Engage aspiring astronomers with activities that examine human populations and then transition onto the stars of the universe. Data and photographs for...
EduGAINs
Data Management
Using a carousel activity, class members gain an understanding of the idea of inferences by using pictures then connecting them to mathematics. Groups discuss their individual problems prior to sharing them with the entire class. The...
National Mississippi River Museum & Aquarium
Sun Printing
Ozalid acid paper is sensitive to the light. It reacts by getting darker, and it's the same paper photographers use when they print their pictures. Here, kids get to use photo-sensitive paper to create sun prints to find out how useful...
Alabama Learning Exchange
Yummy Apples!
Young learners listen to a read aloud of Gail Gibbons book, Apples and the story A Red House With No Windows and No Doors. They compare characteristics of a number of kinds of apples, graph them and create a apple print picture. Learners...
Other popular searches
- Coordinate Picture Graphs
- Christmas Picture Graphs
- M&m Picture Graphs
- Hidden Picture Math Graphs
- Picture Graphs Worksheets
- Math Lessons Picture Graphs
- 5th Grade Picture Graphs
- Bar and Picture Graphs
- Thanksgiving Picture Graphs
- Circle and Picture Graphs
- Picture Graphs Template
- Reading Picture Graphs


