Curated OER
The Very Hungry Caterpillar
Read the story, The Very Hungry Caterpillar, and complete activities from multiple subjects. Make a mural, create a class graph, discuss the life cycle of a butterfly, research information about butterflies on the Internet and make a...
Curated OER
Pixel Drawings
Middle and high schoolers re-create a magazine photo or other picture and make it into a drawing using pixels. This fun art project should be a hit with your charges! The materials needed to implement the lesson should be easy to get,...
Florida Center for Reading Research
Phonological Awareness - Phoneme Segmenting and Blending, Treasure Chest
Working in pairs, scholars use picture cards to practice segmenting words into phonemes and blending phonemes into words. When a peer answers correctly they place a penny in a treasure chest. Incorrect responses make the card go back in...
Curated OER
Nonfiction Sharing Board
In this nonfiction sharing board worksheet, students complete questions about the books main idea, vocabulary, facts, connections. Students also graph information from the book, go beyond the text, and evaluate how they felt about the...
Sea World
Whales
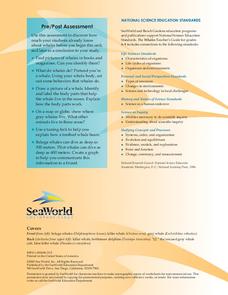
A whale of a lesson is sure to intrigue your elementary oceanographers! Learn about the mammals of the sea with a series of activities about whales, dolphins, and porpoises. Kids complete worksheets about the anatomy of a whale, create a...
Shodor Education Foundation
Sequencer
Take the first step into graphing sequences. Learners set the starting number, multiplier, add-on, and the number of steps for a sequence. Using the inputs, the interactive calculates and plots the sequence on the coordinate plane. Users...
Curated OER
Using Your Marbles - Volume Measurement and Reporting
Demonstrate how to measure the volume of liquids and solids immersed in liquid to your class. They observe a teacher-led demonstration, and in small groups construct a data table that demonstrates how many marbles were used and the...
Shodor Education Foundation
Scatter Plot
What is the relationship between two variables? Groups work together to gather data on arm spans and height. Using the interactive, learners plot the bivariate data, labeling the axes and the graph. The resource allows scholars to create...
Illustrative Mathematics
Half of a Recipe
Kids love to cook! What is a better place to learn mixed numbers than with a recipe? It is up to learners to decide how they want to divide this recipe in half. They may choose to model the mixed number and then divide the model by two....
Illustrative Mathematics
How Many _______ Are In. . . ?
Help your learners gain meaningful understanding of dividing fractions using fraction models. The activity includes nine problems which are sequenced to show how the fraction division algorithm evolves. Have students use graph paper or...
Teach Engineering
Applying Statistics to Nano-Circuit Dimensions in Fabrication
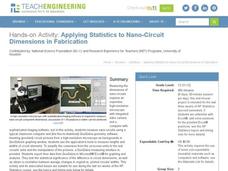
Do flexible circuits change dimensions during fabrication? Groups use GeoGebra software to measure the length of pictures of flexible nano-circuits. To determine if the circuits change dimensions, future engineers use Microsoft Excel to...
Curated OER
Come On Down!
Begin with an introduction to famous deep-sea submersibles. Learners work in groups to gather information on different vessels and then share with the class. Each group then uses water displacement to help calculate the density of...
Curated OER
Coral Bleaching in the Caribbean
Students practice analyzing images, maps and graphs from Internet-based educational resources. They explore the correlation between sea surface temperature and coral bleaching. Students comprehend that coral reefs are collections of tiny...
National Museum of Nuclear Science & History
Alphas, Betas and Gammas Oh, My!
Referring to the periodic table of elements, nuclear physics learners determine the resulting elements of alpha and beta decay. Answers are given in atomic notation, showing the atomic symbol, mass, atomic number, and emission particles....
Shodor Education Foundation
Recursion
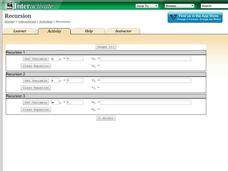
Perform the operation ... and then do it again. Scholars investigate recursive formulas by creating and graphing them. Using the interactive, pupils set the variable, determine the initial value, and type in a recursive formula.The...
Curated OER
Star Reading
Learners of all ages discover the importance of reading fluently by viewing celebrities reading children books and telling about their personal paths to fluency. They participate in a fluency reading routine that connects them with a...
Super Duper Publications
Difficult Situations Fun Deck
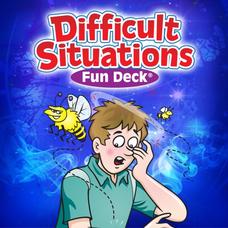
What would you do? Fifty-six illustrated picture flash cards provide players with an opportunity to talk about difficult situations, practice responses to awkward or uncomfortable situations, and consider how to deal with dangerous...
Curated OER
Drawing to Scale
Students examine the process of drawing a picture to scale. They analyze and discuss real-life blueprints for a house, and create a scale drawing of an original invention using calculators and rulers.
Curated OER
Tides in the Hudson
Students view an illustration of the Hudson River watershed and identify the bodies of water shown. They discuss what happens when fresh and salt water mix. Students view a teacher demonstration of the stratification of fresh and salt...
Curated OER
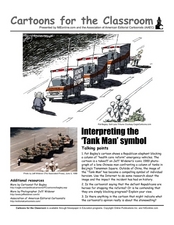
Cartoons for the Classroom: Interpreting the "Tank Man" Symbol
The iconic image of the Tank Man is imitated in this political cartoon analysis, in which learners examine a cartoon depicting a similar standoff. The original image is pictured, and learners compare it to a more modern cartoon of the...
Curated OER
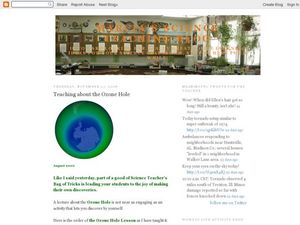
Teaching About the Ozone Hole
A PowerPoint and an accompanying worksheet introduce young meteorologists to the hole in the ozone layer. Another handout provides a coloring and graphing activity which examines the changes in the ozone. There are also links to neat...
Curated OER
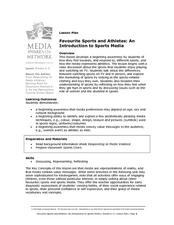
Favorite Sports and Athletes: an Introduction to Sports Media
Even young children watch sports and like team logos and products. It's never too early to think critically about what's onscreen. This exercise develops awareness that media communicate values (i.e. who participates in sports and who...
Illustrative Mathematics
Security Camera
A different-than-normal problem that allows learners to practice their reasoning to find an answer. The problem bases itself off a graph drawing of a store that needs to install security cameras. The challenge is to find which placement...
Education.com
Measure School Supplies
Ever wonder how long a pair of scissors are? Find out with this simple measuring activity in which pupils use the provided ruler to determine the length of four common classroom supplies.
Other popular searches
- Coordinate Picture Graphs
- Christmas Picture Graphs
- M&m Picture Graphs
- Hidden Picture Math Graphs
- Picture Graphs Worksheets
- Math Lessons Picture Graphs
- 5th Grade Picture Graphs
- Bar and Picture Graphs
- Thanksgiving Picture Graphs
- Circle and Picture Graphs
- Picture Graphs Template
- Reading Picture Graphs


