Math Mammoth
Grade 1 Worktext
Use graphing, counting, and number lines to help first graders learn about addition and subtraction. An array of worksheets and activities are an excellent resource for your math lesson, whether you are focusing on counting skills or...
Math Drills
Christmas Cartesian Art Tree
Spruce up graphing practice with an activity that has young mathematicians plot points on a coordinate plane, and then connect the points to create a Christmas tree.
NOAA
What Killed the Seeds?
Can a coral cure cancer? Take seventh and eighth grade science sleuths to the underwater drugstore for an investigation into emerging pharmaceutical research. The fifth installment in a series of six has classmates research the wealth of...
Shodor Education Foundation
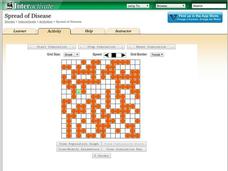
Spread of Disease
Control the spread of a contagious disease. An applet allows pupils to run a simulation on the spread of a disease. Rules govern how the disease is spread and the length of time it takes to recover. Learners view the spread visually and...
American Statistical Association
EllipSeeIt: Visualizing Strength and Direction of Correlation
Seeing is believing. Given several bivariate data sets, learners make scatter plots using the online SeeIt program to visualize the correlation. To get a more complete picture of the topic, they research their own data set and perform an...
Curated OER
Going My Way?
Students discuss how each one of them leaves school each day. They create and analyze a class graph displaying the information collected.
Curated OER
Nine Examples for Tables, Pictographs, Mean. Median, and Mode
In this graphical representation of data and measures of central tendency worksheet, students calculate mean, median, and mode and answer questions related to graphs, tables, and pictographs.
Curated OER
Great Graphs
Students create graphs by tabulating their preferences among 10 state quarters. They examine quarters and tally their favorites. They complete a worksheet. There are more lesson plans included in this unit.
Curated OER
'The Flood'
Students hear the story "The Flood," and take a survey of the favorite pet animals in the class. They take the information complied in the survey and make a bar graph to show favorite pet animals using the computer program KidPix.
Curated OER
Sweethearts and Data Analysis
Learners explore the concept collecting and representing data. In this collecting and representing data lesson, students record the different colors of sweetheart candies in their sweethearts box. Learners create a table of the data and...
Curated OER
Flavorful Spreadsheets
Students create a spreadsheet which includes a bar graph. They sort and classify information and use the average function on a spreadsheet. They research Skittles candy and summarize their findings on a spreadsheet.
Curated OER
Apples A Peel To Me
First graders gather, record and interpret data. In this math lesson plan, 1st graders collect data from their classmates regarding their favorite types of apples. Students use the data collected to explore the use of real graphs and...
Curated OER
OUR FAVORITE BEARS
Students state bear facts aloud, practice counting the nuber of bears aloud on the picture graph, read the picture graph and answer questions aloud about the data on the picture graph, and draw a picture of their favorite bear.
Curated OER
Solutions, Solutions, Could it Be?
Students graph and solve linear system of equations. In this algebra lesson plan, students use algebraic and graphing methods to solve their systems. They find the point of intersection for their solution and draw inference from their data.
Curated OER
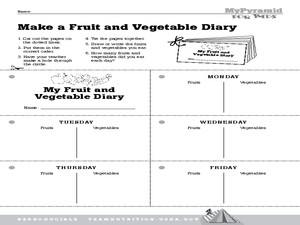
Lesson 3: Vary Your Veggies and Focus on Fruits
Young scholars explore fruits and vegetables. In this nutrition lesson, students generate a list of all known fruits and vegetables. Young scholars cut out and compile pages for a weekly fruits and vegetable journal. Students complete...
Curated OER
Seasons
Students listen to stories about the seasons, and discuss the kinds of clothing people wear for each season. They take a walk, collecting items to go with each season, then draw pictures to match the season.
Curated OER
Engineering Design and Problem Solving
Twelfth graders determine the pixels in photos. In this engineering lesson plan, 12th graders design a picture mosaic using the computer. They design their own class picture.
Curated OER
Can you find the transportation?
Students locate and name different types of transportation. They categorize types of transportation by where you find them: land, air, or water. Students graph the information collected. Additional ideas are listed for cross curriculum.
Curated OER
Me on the Map: Homes, Neighborhoods, and Communities
Students read a book about maps and identify the differences between a picture and a map. In this maps lesson plan, students also label maps of their home, neighborhood, and community.
Curated OER
Graphs of Functions
In this using function tables to problem solve learning exercise, students interpret and complete function tables to solve problems. Students solve six word problems.
Curated OER
Swimmy's Friends
Students solve problems using various strategies. For this problem solving lesson, students read the book Swimmy by Leo Lionni. Students make fish swimming patterns, measure how many goldfish crackers it takes to make a handprint and...
Curated OER
Sound Pictures
Students examine the components of a sonar system. In this physical science lesson students explain how multibeam and sidescan sonar systems are useful to ocean explorers. Students simulate sonar operations in an activity using a motion...
Curated OER
Virtual Field Trip / Route, Mileage and Gasoline Cost Graphs
Students use a spreadsheet program to graph and compare milage, gasoline costs and travel time for two travel routes in their virtual field trip in Michigan. They determine the most economical route based on the graphs and calculations.
Curated OER
Graphing Water Temperature
Students graph water temperature using probe software and a Palm on a class field trip to a lake or pond. Emphasis is placed on collaboration with high school science students and the use of ImagiProbe software.
Other popular searches
- Coordinate Picture Graphs
- Christmas Picture Graphs
- M&m Picture Graphs
- Hidden Picture Math Graphs
- Picture Graphs Worksheets
- Math Lessons Picture Graphs
- 5th Grade Picture Graphs
- Bar and Picture Graphs
- Thanksgiving Picture Graphs
- Circle and Picture Graphs
- Picture Graphs Template
- Reading Picture Graphs


