Curated OER
Christopher Columbus
Youngsters who are just beginning to learn about the age of exploration do a study of Christopher Columbus. They each select four pictures from the voyage of 1492 and write a caption below each one stating what is happening. The class...
Curated OER
Froot Loop to the Max - Ordered pairs
In this Froot Loop to the Max worksheet, students complete 21 different sets of ordered pairs. They plot each of the ordered pairs listed on the sheet, connecting them in order from #1 through #21. Then, students determine whether it is...
Curated OER
Picture a Nation
Learners research immigration data from a specific time period. They create a graphic organizer that depicts the information and share the information with the class.
Curated OER
Career Graph
Second graders explore different careers and what is needed to perform them.
Curated OER
Name Clothesline Graph
Student matches the initial letter of his/her name with the corresponding letter on the clothesline. They then participate in the classroom discussions by offering information relevant to the topic and answering or asking questions...
Curated OER
Grab Bag Experiment
Students analyze and record data. In this lesson about graphing and gathering data, students learn about the step of an experiment. Students learn new vocabulary, sort beans, record the data, and graph the data. Students add a variable...
Curated OER
Weather "Whys" Lesson 4: Spring
Students explore the attributes of spring. In this weather lesson plan, students collect data regarding weather from various media. Students graph simple weather data and dress animals for forecasted weather. Students discuss the...
Curated OER
Weather "Whys"
Students complete activities to explore fall weather. In this weather lesson, students use the given links to examine weather forecasts. Students complete a weather graph activity and watch Internet field trips. Students complete fall...
Curated OER
Time and Rate
In this rate graphing worksheet, students graph four examples of rate vs. time. Then students complete 20 short answer questions.
Curated OER
Introduction to Solving Quadratic Equations by Factoring
Students solve quadratic equations. In this algebra lesson, students factor and graph linear and quadratic functions. They identify the standard and linear form of each equation.
Curated OER
The Hudson's Ups and Downs-Hudson River Activity
In this Hudson River worksheet, students read a short passage about the river, compare graphs of water levels at different locations, label high and low tides on a graph and interpret, and answer comprehension questions based on several...
Curated OER
Circle Art
Learners investigate two and three dimensional shapes. In this geometry lesson, students write equations of circles and graph them correctly. They create pictures using circles.
Curated OER
Name Fame
First graders learn the uniqueness of their names by reading the book, Chrysanthemum, and completing other integrated math counting and graphing activities.
Curated OER
Worksheet 27 - Fall 1995
In this math worksheet, students find the area bounded by the tangent line, the x-axis, and the line x =2. They also describe the graph of the function.
Curated OER
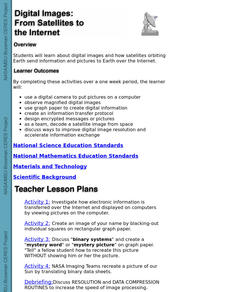
Digital Images: From Satellites To The Internet
Learners examine digital images and how satellites orbiting Earth send information and pictures to Earth over the Internet. They use a digital camera to put pictures on a computer and decode a satellite image from space.
Curated OER
How Does a Seed Grow Into a Plant?
Second graders explore how seeds grow into plants. They discuss types of seeds and place seeds in wet paper towels to germinate. They draw a picture in their journal to record their observations for four days. They take pictures of their...
Curated OER
Tiling a Patio
Fifth graders practice, with spreadsheets, to demonstrate how to determine the number of tiles needed to create a patio. They use pictures and gathered data to determine a pattern that can be used to solve problems. Students create a...
Curated OER
Weather "Why"
Students research weather and explore how to use their research information. In this weather information lesson, students visit a given website for weather forecasts. Students graph the weather, sing weather songs and select a class...
Curated OER
A Birthday Basket for Tia
Students practice reading and math skills using technology. In this main idea instructional activity, students retell the important events of A Birthday for Tia in sequence using Kid Pix. Students create a bar graph using The Graph...
Curated OER
Mathematical Magazines
Students look through magazines and calculate the percentages of the types of ads in the magazines. In this percentages lesson plan, students create a graph to show their results.
Curated OER
Class Time Capsule
Students record and graph information about themselves and the class. They put the information in a time capsule that they reopen at the end of the year.
Project SMART
Dinosaur Trek
Second graders investigate dinosaurs. They explore various websites, submit questions to a paleontologist online, construct cut and paste model dinosaur skeletons, develop a graph to compare dinosaurs, and label pictures from online...
Curated OER
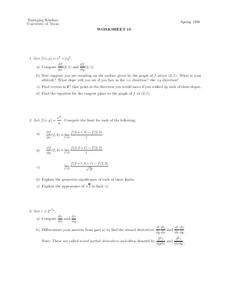
Worksheet 18
In this math learning exercise, students graph the function. Then they determine the altitude in relation to the graph of the function using point (2,1).
Other popular searches
- Coordinate Picture Graphs
- Christmas Picture Graphs
- M&m Picture Graphs
- Hidden Picture Math Graphs
- Picture Graphs Worksheets
- Math Lessons Picture Graphs
- 5th Grade Picture Graphs
- Bar and Picture Graphs
- Thanksgiving Picture Graphs
- Circle and Picture Graphs
- Picture Graphs Template
- Reading Picture Graphs


