Curated OER
The Square Counting Shortcut
An excellent lesson that encourages students to discover how complex figures can be broken into simpler shapes when measuring area. Working with block letters, learners are given the freedom to develop their own strategies for...
Curated OER
Pictures of Data
In this data worksheet, students look at maps and charts and answer multiple choice questions about them. Students complete 10 questions.
Living Rainforest
Finding the Rainforests
From Brazil to Indonesia, young scientists investigate the geography and climate of the world's tropical rain forests with this collection of worksheets.
Curated OER
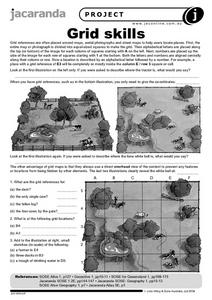
Grid Skills
In this geography activity, students use grid references on a map to locate places in the pictures given. They also identify another advantage of using a grid map, which they have an overhead view of the content to prevent any features...
K12 Reader
Displaying Data
It's important to learn how to display data to make the information easier for people to understand. A reading activity prompts kids to use context clues to answer five comprehension questions after reading several paragraphs about...
EduGAINs
Data Management
Using a carousel activity, class members gain an understanding of the idea of inferences by using pictures then connecting them to mathematics. Groups discuss their individual problems prior to sharing them with the entire class. The...
Curated OER
Nonfiction Sharing Board
In this nonfiction sharing board worksheet, students complete questions about the books main idea, vocabulary, facts, connections. Students also graph information from the book, go beyond the text, and evaluate how they felt about the...
Sea World
Whales
A whale of a lesson is sure to intrigue your elementary oceanographers! Learn about the mammals of the sea with a series of activities about whales, dolphins, and porpoises. Kids complete worksheets about the anatomy of a whale, create a...
Illustrative Mathematics
Half of a Recipe
Kids love to cook! What is a better place to learn mixed numbers than with a recipe? It is up to learners to decide how they want to divide this recipe in half. They may choose to model the mixed number and then divide the model by two....
Illustrative Mathematics
How Many _______ Are In. . . ?
Help your learners gain meaningful understanding of dividing fractions using fraction models. The activity includes nine problems which are sequenced to show how the fraction division algorithm evolves. Have students use graph paper or...
Curated OER
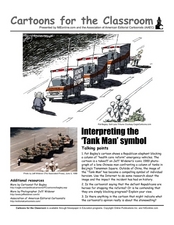
Cartoons for the Classroom: Interpreting the "Tank Man" Symbol
The iconic image of the Tank Man is imitated in this political cartoon analysis, in which learners examine a cartoon depicting a similar standoff. The original image is pictured, and learners compare it to a more modern cartoon of the...
Illustrative Mathematics
Security Camera
A different-than-normal problem that allows learners to practice their reasoning to find an answer. The problem bases itself off a graph drawing of a store that needs to install security cameras. The challenge is to find which placement...
Education.com
Measure School Supplies
Ever wonder how long a pair of scissors are? Find out with this simple measuring activity in which pupils use the provided ruler to determine the length of four common classroom supplies.
Math Mammoth
Grade 1 Worktext
Use graphing, counting, and number lines to help first graders learn about addition and subtraction. An array of worksheets and activities are an excellent resource for your math lesson, whether you are focusing on counting skills or...
Math Drills
Christmas Cartesian Art Tree
Spruce up graphing practice with an activity that has young mathematicians plot points on a coordinate plane, and then connect the points to create a Christmas tree.
Curated OER
Nine Examples for Tables, Pictographs, Mean. Median, and Mode
In this graphical representation of data and measures of central tendency worksheet, students calculate mean, median, and mode and answer questions related to graphs, tables, and pictographs.
Curated OER
Graphs of Functions
In this using function tables to problem solve learning exercise, students interpret and complete function tables to solve problems. Students solve six word problems.
Curated OER
Organizing Data
In this tally chart worksheet, students complete a tally chart of the number of each animal they see in the picture and answer short answer questions about it. Students complete the chart for 5 animals and answer 3 questions.
Curated OER
Count and Tally
In this counting skills worksheet, students respond to 4 questions that require them to count items pictured and use tally marks to total them.
Curated OER
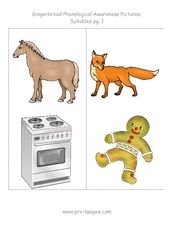
Gingerbread Phonological Awareness Pictures: Syllables
In this syllables worksheet, students say the name of the horse, fox, gingerbread man, and stove. Students listen to the phonological sounds and syllables in the words.
Curated OER
Missing Pattern Blocks
For this pattern blocks worksheet, students look for missing pattern blocks, record them in a graph, and then put them away. The graph contains a picture of each pattern block.
Worksheet Web
Using Pictographs
If one ice cream cone represents three ice cream scoops, and Bob has four ice cream cones, then how many scoops does Bob have? Learners solve these kind of questions with their new understanding of pictographs.
Howard Hughes Medical Institute
Color Variation over Time in Rock Pocket Mouse Populations
A species-specific look at natural selection, the resource herein examines how adaptations have helped the population of rock pocket mice survive in a changing landscape. To begin, middle or high schoolers watch a 10.5 minute video,...
Math Stars
Math Stars: A Problem-Solving Newsletter Grade 6
Think, question, brainstorm, and make your way through a newsletter full of puzzles and word problems. The resource includes 10 different newsletters, all with interesting problems, to give class members an out-of-the box math experience.
Other popular searches
- Coordinate Picture Graphs
- Christmas Picture Graphs
- M&m Picture Graphs
- Hidden Picture Math Graphs
- Picture Graphs Worksheets
- Math Lessons Picture Graphs
- 5th Grade Picture Graphs
- Bar and Picture Graphs
- Thanksgiving Picture Graphs
- Circle and Picture Graphs
- Picture Graphs Template
- Reading Picture Graphs


