Curated OER
Worksheet 27 - Fall 1995
In this math worksheet, students find the area bounded by the tangent line, the x-axis, and the line x =2. They also describe the graph of the function.
Curated OER
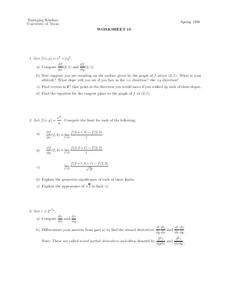
Worksheet 18
In this math learning exercise, students graph the function. Then they determine the altitude in relation to the graph of the function using point (2,1).
Curated OER
Worksheet 28 - Spring 1996
In this math instructional activity, students examine the graph in polar coordinates of r = f(θ). Then they sketch a graph of the modified functions indicated.
Curated OER
Worksheet 30 Spring 1996
In this math worksheet, students examine the functions for their properties to determine if they are real or not. They also graph them according to their domain and range.
Curated OER
Measurement Enrichment Worksheet- Using Mouse Measures
In this measurement enrichment worksheet, 2nd graders use a picture of a mouse as a unit of non-standard measurement to complete a chart. They record the shortest items and longest item in 2 questions below the chart.
Curated OER
Worksheet 23
In this math worksheet, students practice using summation notation. Then they draw a picture of a sequence of partitions in which the mesh does not go to 0.
Curated OER
Functions of Two Variables
In this function of two variables worksheet, students explore the relationship between the derivatives of a function and the shape of the graph. They determine the maximum and minimum value using optimization. Students find the...
Curated OER
Worksheet 3
students conduct an experiment by attaching a belt to a chair. Then they investigate the math concept for how something can rotate in three dimensional space. They graph the solution.
Curated OER
Find and Color
For this early childhood shape recognition worksheet, students find circles, triangles, and rectangles in a picture and color them according to the instructions. Students graph the number of each of the 3 shapes on the provided table.
Curated OER
Patterns in Nature
In this patterns in nature learning exercise, students read about the Fibonacci Spiral, then follow the directions to plot one on the graph paper and draw the spiral, with links to more information.
Curated OER
A Country’s Shape Is More Than Its Borders
In this geography skills instructional activity, students read an article and examine graphs about population prior to answering 13 short answer questions and 10 multiple choice questions. Students then respond to the writing prompt...
Curated OER
Pictographs
In this pictographs worksheet, 7th graders solve 6 different problems related to the pictograph shown at the top of the sheet. First, they pretend that they counted birds and their numbers are represented in the pictograph. Then,...
Curated OER
Ellipses
In this ellipses worksheet, 11th graders solve and complete 4 different problems. First, they define what an ellipse is and draw a picture. Then, students find the coordinates of the center and the foci and the lengths of the major and...
Curated OER
New York State Testing Program: Mathematics Test Book 1
In this mathematics test bookelt, students solve problems studied during the year. They solve problems covering topics such as probability, angle intersection, commission, percent, exponents, similar figures, and reading and...
Curated OER
Woodland Math Facts
In this Woodland math facts activity, students study and examine woodland weights of trees and shrubs, explore invertebrates and draw a bar chart to chart their findings.
Curated OER
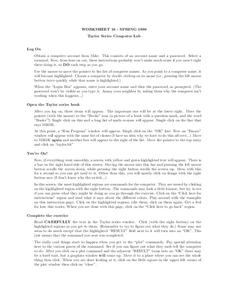
Worksheet 16 - Spring 1996
In this math worksheet, students read the instructions for setting up a computer program. Then they practice graphing the functions with the software program.
Curated OER
Numerical Analysis: Analyzing Root Finding Algorithms
In this root finding worksheet, students compare graphs and shade in regions corresponding to given convergence criteria. They compute the solution of equations of one variable. This two-page worksheet contains six problems.
Curated OER
Button Sort
In this sorting activity worksheet, students sort 12 pictures of different buttons by an attribute that is determined by the teacher. They sort the buttons on the chart using a variety of sorting attributes.
Curated OER
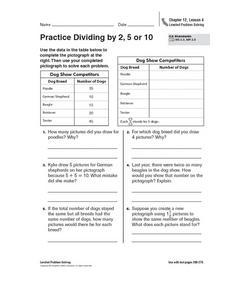
Practice Dividing by 2, 5, or 10
In this pictograph problem solving worksheet, students analyze the data on a table and create a pictograph. Students read and solve 6 story problems about the pictograph.
Curated OER
Equal Parts
In this equal parts worksheet, students, working with a partner, study, formulate and calculate the answers to six word problems or drawings.
Curated OER
Problem Solving: Use a Table Reteach 16.8
In this problem solving worksheet, students learn to look for information in a data table. Students answer 6 questions about a data table.
Curated OER
A Christmas Place
In this graphing worksheet, learners plot the points on the graph to create a picture of a Christmas tree. Students plot 37 points and connect them where told to.
Curated OER
Worksheet 22 - Spring 1996
students examine the potential of creating the involute for a circle. They use the concept to create new parametric equations. They graph the picture for each.
Curated OER
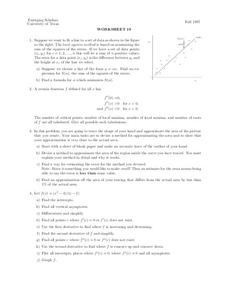
Worksheet 19
In this math instructional activity, students try to fit a line to a set of data. Then they use the least squares method is based on minimizing the sum of the squares of the errors.
Other popular searches
- Coordinate Picture Graphs
- Christmas Picture Graphs
- M&m Picture Graphs
- Hidden Picture Math Graphs
- Picture Graphs Worksheets
- Math Lessons Picture Graphs
- 5th Grade Picture Graphs
- Bar and Picture Graphs
- Thanksgiving Picture Graphs
- Circle and Picture Graphs
- Picture Graphs Template
- Reading Picture Graphs


