Curated OER
Cindy and Linda - Selling Lemonade
In this pie charts activity, students use the pie chart to count how many glasses of Lemonade were sold by Cindy and Linda. Students complete the table and answer 3 questions.
Curated OER
Sunspot Activity
In this sunspot activity worksheet, students are given a table with 3 types of flares produced by sunspots based on their brightness. Students answer 5 questions by interpreting the data and they determine the percentages of the...
Sharp School
Geography Project
This very simple geography project can lead to a lot of useful referential information that can be displayed in your classroom! Learners construct a poster-size map of a country, identifying major demographic points and including pie/bar...
Curated OER
A Recipe for Air
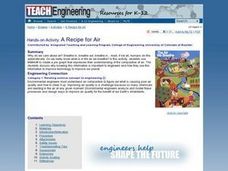
Students create a pie graph using M&Ms to demonstrate the composition of air. They label each section of the graph, and list the fractions from largest to smallest.
Curated OER
Math Centers
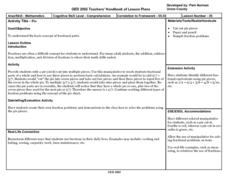
Fifth graders review the concepts of fractions: improper, mixed, proper, like denominator addition. They then review the concepts of creating pie graphs using a percent circle using manipulatives.
Curated OER
Tim and Pat - At the Store
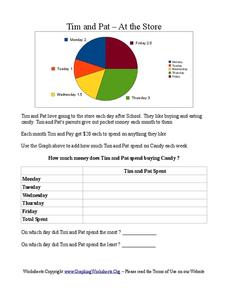
For this pie chart worksheet, students use the pie chart to add the amount of time Tim and Pat spend buying candy each day of the week. Students answer 2 questions about the table.
Agriculture in the Classroom
Pumpkins... Not Just For Halloween
Celebrate fall with four pumpkin themed hands-on activities! After learning about pumpkins, scholars complete two activity sheets that reinforce estimation and word problems. They then plant pumpkin seeds and bake a pie in...
Earth Day Network
Conserving Water Through Art!
Having fresh, clean drinking water is a privilege many people take for granted. Help raise awareness about the scarcity of water and the importance of conservation by discussing different ways water is used in everyday life. Brainstorm...
Curated OER
Graphing Using Cookies
Students differentiate between bar graphs, line graphs, pictographs and bar graphs. After participating in a hands-on cookie activity, students label and draw their own graphs.
Curated OER
Handling Data: Comparing Distributions
Students gather information by analyzing graphs, diagrams and pie charts. In this graphs and diagrams lesson, students complete addition and subtraction problems. Students discuss a pie chart. Students use information to crate a stacked...
Curated OER
Spreadsheet Graphs
Students create graphs using information from spreadsheets. They select a topic from the following choices: website use, digital cameras, spreadsheets, calculators or educational software. They tally the class results and create an...
Curated OER
Graphing Favorite Fruit
Third graders take poll and sort data, enter the data to create a spreadsheet and create bar and pie graphs.
Curated OER
Count The Letters
Students perform activities involving ratios, proportions and percents. Given a newspaper article, groups of students count the number of letters in a given area. They use calculators and data collected to construct a pie chart and bar...
Curated OER
Recycling Statistics
In this environment worksheet, students look for the answers to the environmental impact of recycling in Great Britain with the statistics from the pie graph.
Curated OER
State Economy Chart
Fifth graders research and record statistics on the economy of an assigned state. They create a spreadsheet in Excel to report the data and a 3D Pie graph using the Chart Wizard in Excel to represent their states' data.
Curated OER
Gross Domestic Pizza
Learners explore major components of gross domestic product (GDP) and how it is determined; students create and compare GDP pie charts for the countries of Pepperonia and Anchovia.
Curated OER
Time Management
Students plot activities for a 24 hour day. They record their information on a spread sheet program. Students list categories they use and write equations for cells that add cells of each category together. Students create a pie chart of...
Curated OER
What's Air Got to Do with It?
Students use M&M's to create a pie graph that expresses their understanding of the composition of air. They watch and conduct several simple experiments to develop an understanding of the properties of air (it has mass, it takes up...
Curated OER
Data Display
Students explore different ways to display data. In this statistics lesson, students create pie charts, bar graphs and line graphs to show data. Students then write a paragraph discussing which types of graphs are helpful for different...
Curated OER
All in the Circles
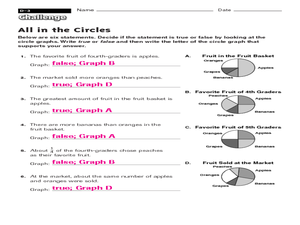
In this circles instructional activity, students use 4 circle/pie chart graphs to answer a set of 6 questions. Answers are included on page 2.
Curated OER
Fraction Activities
Second graders will match the pie graphs with the name of the fraction. In the second activity the children should color part of the pictures in the rectangle to represent the fraction shown. They should also color in the pie graphs to...
Curated OER
Investigating: Interpreting Graphs and Analyzing Data
Students explore statistics by researching class birthday data. In this data analysis lesson plan, students investigate the different birthdays among their classmates and create data tables based on the given information. Students view...
Curated OER
Fractions: Pie
Learners use a pie (circle) to study fractions. They create their own fraction problems and demonstrate to their classmates how to solve the problems. They discuss ways they use fractions in their daily lives.
Curated OER
A Thanksgiving Story
In this active and passive voice worksheet, middle schoolers read a paragraph regarding Thanksgiving and then rewrite five of the sentences in passive voice.


