Curated OER
Collecting Data
In this data collection activity, students read about how data is collected and organized. They also learn about a hypothesis. Students read through examples of different charts and then answer 23 questions pertaining to data collection....
Curated OER
Australian Settlers
Young scholars interpret graphs and research events to identify links between events in the world and the arrival and plight of immigrant groups. They discuss the myths about immigration.
Curated OER
Data Handling
In this data handling learning exercise, students explore multiple ways to represent data. They create stem and leaf plots, histograms, and bar charts. Students examine and interpret diagrams and statistics. This...
Curated OER
Probability Fun
What are the chances? Probability comes into play in this worksheet as mathematicians examine a circular chart with images, determining the possibility that the "spinner" will land on each of the images. Appropriate for younger...
Curated OER
Calculate Percentages
Sixth and seventh graders study the concept of finding the percent of a number. They calculate the percent of any given number. Pupils describe ways to use calculating percents in their daily life, and change percents into decimals,...
Curated OER
Data Handling
In this data handling worksheet, students interpret data found in table, graphs and charts. They organize data and draw bar charts. This two-page worksheet contains 2 multi-step problems.
Curated OER
Chocolate Preferences Voting and Graphing Techniques
Students practice sampling and graphing techniques. In this data collection and interpretation lesson, students write and conduct surveys about chocolate preferences and then collect their data. Students graph the data in order to...
Curated OER
The Numbers Tell the Story
Young scholars demonstrate how to gather and interpret statistical data. In this data analysis lesson, students search for statistics on the health effects of smoking and place the information into charts. Young scholars create these...
Curated OER
Counting Candies
Students count, sort, and classify jellybeans by color. They use their data to create a bar graph. Students are given a small bag of jellybeans, and a worksheet on Counting Candies Tally Chart. They work in small groups. Students are...
Curated OER
Handling Data: Comparing Distributions
Students gather information by analyzing graphs, diagrams and pie charts. In this graphs and diagrams lesson, students complete addition and subtraction problems. Students discuss a pie chart. Students use information to crate a stacked...
Curated OER
Let's Go Shopping
In this fraction and pie chart worksheet, students draw a line from the toys with the prices of 50 cents, 75 cents, and 25 cents to the pie chart that show the part of a dollar the toy costs.
Curated OER
Twelve Days of Christmas
Students create charts and graphs using a spreadsheet. They chart the number of each gift given day by day from the song, "The Twelve Days of Christmas." They create a bar graph and a circle graph from their data on the spreadsheet.
Curated OER
Budget Making
After analyzing a pie graph of national spending, high schoolers express their opinions on priorities for national spending. They create a new bar graph and mail it to their congressional representative with recommendations about needed...
Curated OER
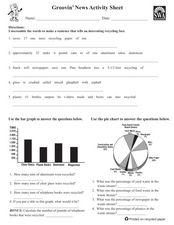
Groovin' News Activity Sheet
In these recycling worksheets, students complete several activities to learn about recycling. Students complete a word search, word scramble, bar graph, pie chart, research project, class project, and individual project for recycling.
Curated OER
Graphing Data
Students graph lines in a coordinate plane. In this geometry lesson plan, students graph lines on a coordinate plane, and identify the slope. They calculate the volume, area and perimeters of the shapes created on a coordinate plane.
Curated OER
Using Excel To Teach Probability And Graphing
Students engage in the use of technology to investigate the mathematical concepts of probability and graphing. They use the skills of predicting an outcome to come up with reasonable possibilities. Students also practice using a...
Curated OER
Simplifying Fractions
In this math worksheet, learners create fractions to represent the pie graphs and then perform the operations to simplify the ratios.
Curated OER
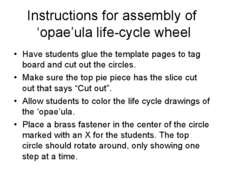
Instructions for Assembly of 'Opae" ula life-cycle wheel
Pupils study Opae ula. In this life cycle, art activity, students color and cut out the printout of the life cycle of the Opae ula (red shrimp of Hawaii). They work independently to create the pie chart representing this life cycle. This...
Curated OER
Data Collection and Presentation
Middle and high schoolers collect and analyze data from four different activities. The activities include information about classmates, tallying colors of cars in a parking lot, stem and leaf plots, and making a histogram from...
Curated OER
Equal Parts
In this equal parts worksheet, learners, working with a partner, study, formulate and calculate the answers to six word problems or drawings.
Curated OER
Math Centers
Fifth graders review the concepts of fractions: improper, mixed, proper, like denominator addition. They then review the concepts of creating pie graphs using a percent circle using manipulatives.
Beyond Benign
Water Bottle Unit
How much plastic do manufacturers use to create water bottles each year? The class explores the number of water bottles used throughout the years to determine how many consumers will use in the future. Class members compare different...
Consortium for Ocean Science Exploration and Engagement (COSEE)
Climate Change Impacts on Blue King Crabs
Carbon dioxide is not only causing global temperatures to increase, it causes the oceans to become more acidic. Lesson focuses on the blue king crab and the fragility of the habitat due to climate change. Scholars create a concept map...
Curated OER
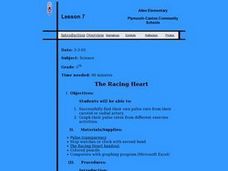
The Racing Heart
Fifth graders locate their own pulse rate from their carotid or radial artery, and graph their pulse rates after completing various exercise activities. They graph their data on a pie graph using Microsoft Excel software.
Other popular searches
- Circle Graphs Pie Charts
- Bar Graphs, Pie Charts
- Bar Graphs Pie Charts
- Graphs and Pie Charts
- Bar Graphs and Pie Charts


