Curated OER
Candy Bar Survey
Second graders investigate the skill of graphing data by using candy bars to create context for the instructional activity. They use technology for graphing and organizing information like a spreadsheet. The instructional activity...
Curated OER
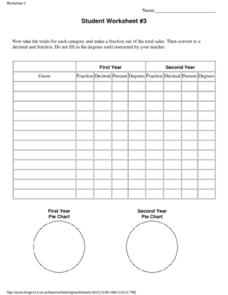
Genre Sales Statistics Percent Worksheet
In this literacy worksheet, learners use the context of music genre sales in order to practice the skills of decimal and percentage conversion.
Curated OER
Oobleck/Slime War
Students compare slime recipes. In this properties of matter lesson, students make Oobleck and glurch and compare the properties of each and examine the solid and liquid properties of them.
Curated OER
Graph Made Easy: Post Test
In this graphs worksheet, students answer multiple choice questions about line graphs and bar graphs. Students answer 10 questions total.
Curated OER
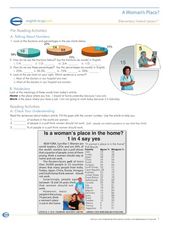
A Woman's Place?
In this women workers lesson, students read an article about women in the workforce and answer 10 questions related to the article. They also convert fractions to percentages.
Curated OER
Publishing Autobiographies 2
Eighth graders identify the 5th step of the writing process and apply the process to student autobiographies. While in the computer lab, they continue to type their autobiographies, and create covers for their autobiographies.
Curated OER
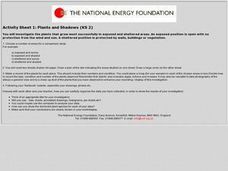
Plants and Shadows
In this science worksheet, students design an experiment to measure the effects of sunlight exposure upon plants while comparing the amount of shade as a correlation.
Curated OER
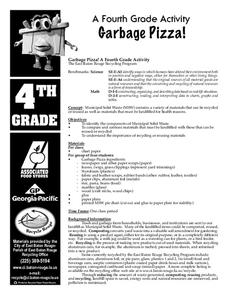
Garbage Pizza
Fourth graders explore the concept of waste management. In this recycling lesson, 4th graders identify materials that must be landfilled as well as items that may be recycled or reused.
Curated OER
"One Day in the Prairie" by Jean Craighead George
Students collect "prairie insects" for data collection and analysis.
Curated OER
Pollution Solution
Students, after discussing oil pollution, generate solutions to an oil spill.
Curated OER
Blue Genes: Affect Your Life!
Students, in groups, research, analyze and synthesize information on genetic diseases. After watching a video on genetics, groups perform research on a variety of genetic diseases and present their findings to the class.
Curated OER
Focused Learning Lesson: Economics
High schoolers review and discuss what skills and knowledge they need to make a decision about a career. They take a test to see which career they would most likely fit into.
Curated OER
Leaping Lemurs! How far can you jump?
Students watch a segment of the PBS video which show the lemurs' ability to jump. In pairs, students collect measurement data involving each other's length of a standard step, a standing broad jump, and a long jump. They record their...
Curated OER
M&M Caper
Students participate in a game with M&M's to be introduced to percents and ratios. Individually, they estimate and record the number of candies they believe the bag holds and the amount of each colored candy. They open the bag and...
Curated OER
Bar and Histograms (What Would You Use: Part 1)
Students practice creating bar graphs using a given set of data. Using the same data, they create a group frequency chart and histograms. They must decide the best graph for the given set of data. They share their graphs with the...
Curated OER
Population Pyramids
Students create a population pyramid based on current data for their final project country. They analyze data from comprehension trends of final project country. Students analyze populations of specific countries.
Curated OER
Data Collection and Presentation
Young scholars concentrate on discrete quantiative data. They are shown that the vertical line diagram as a more appropriate way to present discrete quantiative data then bar charts. Students work as a group to help with the...
Curated OER
Teaching Percentages
Students calculate percentages using the Percent Tricks method. They multiply and divide whole numbers. They count total number of candies in a bag and calculate the percent of each color.
Curated OER
Clock Diagram
In this literacy activity, learners use the created resources for further progress towards knowledge. The sheet is a teacher's guide for creating student resources.
Curated OER
Constant Net Force
In this forces worksheet, students calculate life force, acceleration, and displacement for 8 word problems. Students must label force diagram and a summation force model.
Curated OER
Informational Reading: Electronics Are Made from Resources
In this comprehension activity, students read about the making of a computer: circuit boards, hard drives, monitors and plastic housings. Students then answer 3 multiples choice questions.
Curated OER
Technology has a Solution!
In this technology worksheet, students summarize four things they learned about technology and the environment. Students then write a report that outlines how technology is solving environmental issues.
Curated OER
A Look at the Life That Electronics Lead
In this comprehension worksheet, learners fill in ways on a graphic organizer that people or companies can conserve energy, reduce waste or minimize the impact to the environment. Next, students solve 3 "environmental" math word problems.
Curated OER
Introduction to Graphs: Bar Graphs, Line Graphs, Circle Graphs
In this graphing data worksheet, middle schoolers answer 5 short answer questions about graphs. Students determine which type of graph best represents various data sets.
Other popular searches
- Pie Charts and Graphs
- Line Pie Bar Graph
- Circle Graphs Pie Charts
- Bar Graphs, Pie Charts
- Paper Pie Chart/graph
- Graphing Pie Charts
- Bar Graphs Pie Charts
- Bar Graphs and Pie Charts
- Pie Charts Graphs
- Pie Chart Circle Graph
- Pie Chart Graphs


