Math Worksheets Land
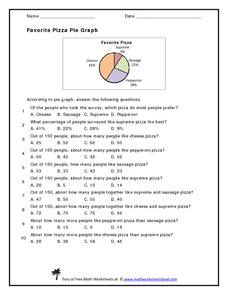
Favorite Pizza Pie Graph
You've heard of a pie graph, but what about a pizza pie graph? Challenge young mathematicians to answer ten questions based on a random survey of people's favorite pizzas. A pie graph displays the percentages of each type of pizza. Some...
Math Worksheets Land
Pie or Circle Graphs—Step-by-Step Lesson
How do you display data that you've collected in a pie chart? Follow a clear step-by-step guide to turning survey results into a visible format. It shows kids how to determine the percentage of the whole that each section represents.
Scholastic
Study Jams! Circle Graph
Over a pizza dinner, RJ and Mia discuss how to use a circle or pie graph to represent data. After viewing, data analysts can use a Test Yourself feature to assess their own understanding. This is ideal for use in a flipped classroom lesson.
Curated OER
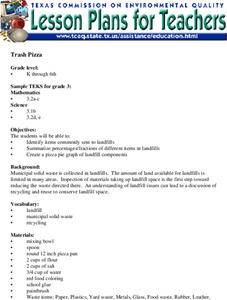
Trash Pizza
Students identify items commonly sent to landfills and summarize percentages/fractions of different items in landfills Students create a pizza pie graph of landfill components
Curated OER
Trash Pizza
Students work together to identify items sent to landfills. They summarize percentages of the different items found in landfills. They create a pizza pie graph of all of the components found in landfills.
Curated OER
Trash a Pizza!
Students investigate data about America's trash production. In this environmental instructional activity, students use statistics about what we throw away to create an art pie chart project called a "trash pizza."
Curated OER
Gross Domestic Pizza
Students explore major components of gross domestic product (GDP) and how it is determined; students create and compare GDP pie charts for the countries of Pepperonia and Anchovia.
Math Mammoth
Multiplying Fractions by Fractions
A four-page resource walks learners through the basics of multiplying fractions. The handout is very visual with many diagrams in various colors. By the end of the lesson, learners are given an opportunity to multiply whole numbers with...
Curated OER
Dynamite Data
Second graders rotate through a variety of stations designed to offer practice in manipulating data. They sort, tally and count items and then create bar graphs, tables, and pie graphs to record their findings.
Curated OER
Favorite Food
Students are given three choices of food. They then decide on their favorite and predict what the class's favorite food will be. After the teacher enters the data into the computer, students gather around the computer to view the...
Curated OER
Circle Graphs
In this circle graphs learning exercise, students solve and complete 8 different problems that include word problems referring to two different circle graphs shown. First, they follow the directions for each problem and complete the...
Curated OER
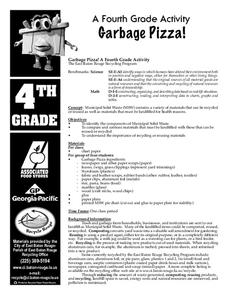
Garbage Pizza
Fourth graders explore the concept of waste management. In this recycling lesson, 4th graders identify materials that must be landfilled as well as items that may be recycled or reused.
Curated OER
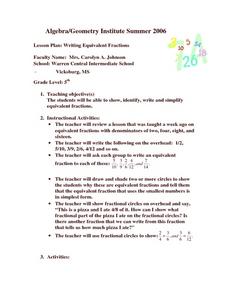
Writing Equivalent Fractions
Fifth graders work to find the fractions that are equal to one another. They use a visual pie graph to show different values. Students are able to see how fractions can look different, yet have the same value.
Curated OER
Circle Graphs
Sixth graders interpret, create, and display data in a circle graph. In this circle graph lesson plan, 6th graders use a compass, protractors, pizza boxes, and more to create a circle graph and analyze the data they put into it.
Curated OER
Area Of Sectors
Student find the area of a sector of a circle. In this geometry lesson, students define the sector of a circle using a sketch. They find and identify examples of sector in the real world.


