Charleston School District
Graphing Functions
How do letters and numbers create a picture? Scholars learn to create input/output tables to graph functions. They graph both linear and nonlinear functions by creating tables and plotting points.
West Contra Costa Unified School District
Decimals and Fractions
Reinforce the concept of fractions and decimals as part of a whole with a lesson that begins with a mixed review, then goes into a three problem guided practice, and ends with a collaborative activity. The guided practice and activity...
Curated OER
McONE Hundredth Day
Students explore the components of a calendar and counting through the preparation and celebration of the "One Hundredth Day" of school. Badges are worn and McDonald fries are enjoyed in the celebration.
Curated OER
Multiplication: A Treasure Hunt to Two and Three Digit by One Digit Multiplication
Here is a math lesson which has learners practice multiplying two and three digit numbers by one digit numbers. They discuss multiplication strategies and use those strategies to play a game.
Curated OER
Music Math: Create a Clapping Symphony (Plus Fraction Math)
Students read simple music to create a symphony of clapping (all grades). Plus fraction math for grades 5-up. They explain how musical notes relate to fractions and identify a variety of musical notes for example, whole, half, and...
Curated OER
It's Close Enough: Rounding and Estimation
Second graders round to the closest five, ten, and hundred. They use place-value concepts of grouping based upon powers of ten (thousandths, hundredths, tenths, ones, tens, hundreds, thousands) within the decimal number system.
Curated OER
I'll Have an Order of Subtraction Please!
Students explore number values by completing consumer math worksheets. For this math functions lesson, students identify the use of a decimal in numbers and the place values that are represented when dealing with money. Students complete...
Curated OER
Global Statistics
Students select appropriate data to determine the mean, median, mode and range of a set of data. They calculate the statistical data on literacy rates and life expectancy within each geographic region of the world. Students determine...
Curated OER
Expanded Form-Thousands
Students write numbers in expanded form. In this math instructional activity, students discover what expanded form represents by observng the teacher writing a number in expanded form on the board in a chart. Additionally, students...
Curated OER
Higher Order Thinking (H.O.T.) Lesson - BIG E
Fourth graders work with patterns while using large numbers. In this patterning lesson plan, 4th graders go over the definitions of the words: predict, estimate, attendance, increase, and decrease. They complete worksheets in which they...
Curated OER
Dollar Word
Students review the value of coins prior to adding up values to equal one dollar. Letters of the alphabet are assigned monetary values and students use calculators to add up the value of a word. Students work with a partner to try and...
Curated OER
Rule of Quarters
Learners memorize four key decimal values for quick and accurate conversion. They convert decimal foot measurements to inches and fractions using math tables, computation or memorization. They memorize decimal foot conversions.
Curated OER
The Number Match Game
Kindergarteners practice matching words and symbols by playing an index card activity. They create flash cards numbered 0 to 20 and challenge each other in groups to identify the values of the numbers. Learners utilize beans or buttons...
Curated OER
And the Number Is (Second Grade)
Second graders create Mystery Numbers. They give the class clues about the name, value, and multiples of the digits which make up the number.
Curated OER
Study Buddies: Comparing and Ordering Decimals
For this math worksheet, students will work with a coach to compare and order numbers with decimals to the hundredths place. Students will follow a step-by-step process and notes are provided for the coach.
Curated OER
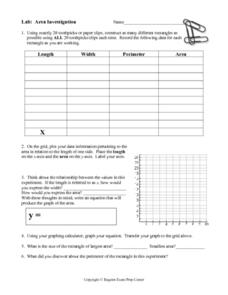
Area Investigation
For this area investigation worksheet, 8th graders solve and complete 6 different problems that include complete a chart with given data and a graph. First, they construct as many different rectangles as possible using toothpicks. Then...
Curated OER
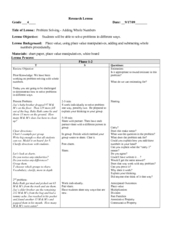
Problem Solving - Adding Whole Numbers
In order to practice problem-solving skills, pupils work through a series of word problems. They each determine an answer and then share their thinking process with the class. This activity demonstrates that there may be more than one...
Virginia Department of Education
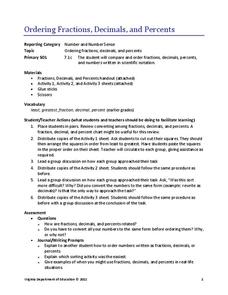
Ordering Fractions, Decimals, and Percents
Order up a resource on comparing rational numbers. Scholars order fractions, decimals, and percents by converting to a single form. They conduct a cut-and-paste activity ordering three sets of rational numbers.
Alabama Learning Exchange
Watch That Plant Grow
Middle schoolers examine the growth of marigolds in a greenhouse environment. They chart data in spreadsheets showing plant growth over time and under a number of conditions. They record measures of plant height and greenhouse temperature.
Curated OER
Coin Carnival
Young scholars investigate the value of coins. In this coin value lesson, students read The Penny Pot by Stuart Murphy. Young scholars expand on skills learned in the book and engage in activities to determine the value of a mixed set of...
Curated OER
Hula Hoop Hullabaloo
Second graders use hula hoops to represent the zero as they count objects into ones, tens, hundreds and thousands. They complete an activity to after they have practiced counting objects.
Curated OER
Expanded Form-Hundreds
Students write numbers in expanded form. In this expanded form lesson, students are shown a demonstration on the board about writing numbers in expanded form to the hundreds place. A 20-problem worksheet and answer key are included.
Curated OER
Marking the Minutes
Students mark seconds, minutes, hours, days, etc. on class timetable report to keep track of time spent on Uninterrupted Silent Reading.
Curated OER
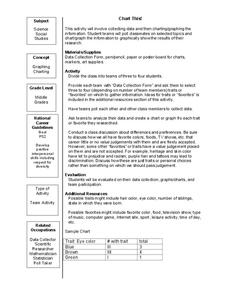
Chart This!
Students collect data and graph or chart the information. In this data organization instructional activity, students poll their classmates about certain topics and chart or graph the information to show the results of their research.


