Curated OER
Math: Road Trip
Twelfth graders use road maps to calculate the distance between two locations. They estimate the cost for fuel and the miles per gallon. They consider other factors such as geography, road conditions, and traffic that may impact the cost.
Curated OER
Imagination Travel
Students watch video segments on shapes and patterns. They create their own pattern within shapes.
Curated OER
Research Cruise Word Problems Lesson Plan
Students explore life onboard the NOAA Research Vessel Ronald H. Brown and practice basic arithmetic by completing word problems.
Curated OER
Math Maven's Mysteries
In these story problem worksheets, students read the story problem 'Mystery of the Peculiar Zoo.' Students use the information within the story to then solve the problems. Students use their multiplication and division skills to...
Curated OER
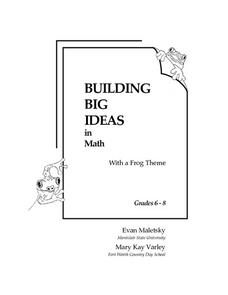
Building Big Ideas in Math With a Frog Theme
In this problem solving worksheet about frogs, students complete two pages of activities. Students figure out how a frog can hop between lily pads following the rules given. Students draw all possible paths.
Curated OER
Math Hook Up
Students practice moving different ways with different locomotor skills. They practice addition and subtraction problems.
Curated OER
How Far Is It?
Students use a map key to estimate the distance from Salt Lake City, Utah, to ten other cities. Then they use an online distance calculator to see how close their estimates come!
Curated OER
What's the Frequency, Roy G. Biv?
Introduce starting space scientists to the electromagnetic spectrum, expecially the portion of visible light. Teach them about wavelength and frequesncy. Then give them a roll of adding machine tape and a manila folder to make a...
Concord Consortium
Cities and Gas Stations
In Utah, one stretch of highway goes for 106 miles without a single gas station. Where should people build one? Scholars face the dilemma of where to place a new gas station between three cities. They consider distance and proximity to...
Alabama Learning Exchange
Ice Cream Sundae Survey
Young scholars analyze data through graphs. They will complete a class survey on ice cream sundaes and tally and graph the responses. They then analyze the information from the class graph.
Curated OER
Bird and Dog Race
Your pupil's pet dog and bird are racing down the city streets. In order to know who is going to win, they better know something about calculating rates, the Pythagorean Theorem, and applying those topics to the map of the city.
Illustrative Mathematics
Walk-a-thon 2
During a walk-a-thon your learners must determine the walking rate of Julianna's progress. Using tables, graphs, and an equation, they must be able to calculate the time it took her to walk one mile and predict her distance based on the...
Curated OER
Put Your Truss in Building Bridges
Students apply abstract concepts, such as stress, fulcrums, the law of gravity, and the strength of different geometric shapes. Groups of student contractors operate simulated architectural firms to create strong, economical bridges.
Curated OER
Measurement and Conversion of Units in a Recipe
In a cross-curricular measurement and literacy lesson, your class will identify and compare cooking measurement instruments. They read a recipe and sequence a set of similar instructions in which the steps have been mixed up....
West Contra Costa Unified School District
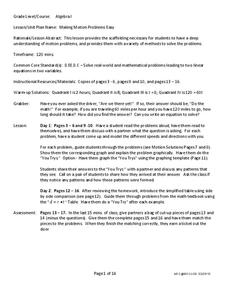
Motion Problems
Let's hope class participants don't get motion sickness. In the lesson, class members first solve motion problems using tables and graphs. They then use algebraic techniques to solve motion problems.
Statistics Education Web
10,000 Steps?
Conduct an experiment to determine the accuracy of pedometers versus pedometer apps. Class members collect data from each device, analyze the data using a hypothesis test, and determine if there is a significant difference between the...
Everyday Mathematics
Mathematics Within: Slope and Triangles
Learners discover a method for determining the slope of a line by creating and comparing similar triangles. They fold coordinate grids to make three similar triangles then measure the sides to compare the relationships between the...
Curated OER
Rescue Mission Game
Students conduct probability experiments. For this rescue mission lesson plan, sudents play a game and collect statistical data. They organize and interpret the data and determine the probability of success. Students plot points on a...
Curated OER
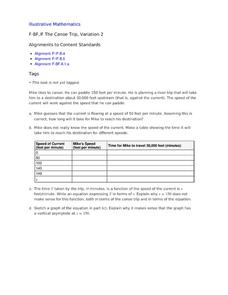
The Canoe Trip, Variation 2
The behavior of a rational function near a vertical asymptote is the focus around this trip up a river. Specifically, numerical and graphical understanding is studied. The canoe context pushes the variables as numbers, rather than as...
Curated OER
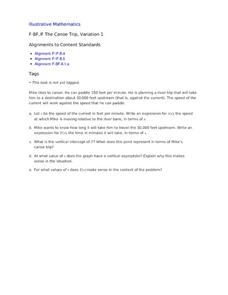
The Canoe Trip, Variation 1
Your river sportsmen will explore an example of paddling upstream as they build functions modeling speed and time in terms of the speed of the current. They then use their algebraic models to interpret features of the function related to...
Curated OER
Stopping Along the Way
Learners use atlases, maps, and Web resources to plan a day trip to at least one city or point of interest that is on the way to their final destination.
Curated OER
A Metric World
Pupils convert English to metric units. In this math lesson, students give examples of measurements they encounter in their daily lives. The share their answers in class.
Curated OER
Time Zones
For this time zones worksheet, students complete the total length of trips for time zones and answer short answer questions. Students fill in 3 spaces in the chart and answer 3 questions.
Curated OER
Analyze The Learner; Chocolate Fractions
Third graders describe, represent and compare fractions using pieces of a chocolate bar. In this fractions lesson, 3rd graders demonstrate how to read and write fractions correctly. Students then integrate technology by using the...


