Curated OER
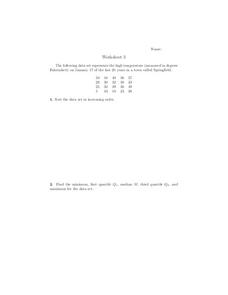
Data Analysis Self-Test
In this data analysis worksheet, students complete 1 problem that has 7 parts involving mean, median, mode, range, and quartiles. Students then perform 5 operations with matrices.
Curated OER
Bringing Facts Into Science Fiction
Students develop a setting, plot and characters for a science fiction story based on current news themes, and then individually write drafts of the story.
Curated OER
Plotting Sunspot Activity
Students explore how to graph sunspots using a solar graph. In this sunspots lesson students investigate sunspots and complete and evaluation worksheet.
Curated OER
Scatterplots
In this scatterplots learning exercise, 9th graders solve and complete 6 different word problems with different sets of data. First, they sort the data set in increasing order and find the minimum, first quartile, median, third quartile,...
Curated OER
Accordion-Book Summary
Students explore summarizing. In this book report lesson, students follow directions to make an accordion book, including illustrating and summarizing important events in the story.
American Statistical Association
Colors Challenge!
Does writing the name of a color in a different colored ink affect one's ability to read it? Scholars design an experiment to answer this question. They collect the data, analyze the statistics, and draw a conclusion based on what they...
EngageNY
Measuring Variability for Skewed Distributions (Interquartile Range)
Should the standard deviation be used for all distributions? Pupils know that the median is a better description of the center for skewed distributions; therefore, they will need a variability measure about the median for those...
Vanier College
Analyzing Short Stories/Novels
Good questions can help focus readers' attention on the elements writers use to add depth to their stories. The questions on this worksheet do just that and encourage readers to think critically about a story and author's purpose.
Fort Bend Independent School District
Data Analysis - AP Statistics
What better way to study survey design than to design your own survey! Bring a versatile data analysis project to your AP Statistics class, and encourage them to apply the practices from their instructions to a real-world survey project.
Orlando Shakes
Pericles: Study Guide
Everyone loves a great riddle, right? Everyone except for the characters in Shakespeare's Pericles, who will be killed unless they answer the king's riddle correctly. With the study guide, scholars use words coined by Shakespeare to play...
EngageNY
Distributions and Their Shapes
What can we find out about the data from the way it is shaped? Looking at displays that are familiar from previous grades, the class forms meaningful conjectures based upon the context of the data. The introductory lesson to descriptive...
Curated OER
Martin Luther King Jr.
After listening to a story about Martin Luther King Jr., first graders answer questions about the text. They discuss the importance of the illustrations, identify the beginning, middle, and end of the story, and complete a writing...
Novelinks
The Tempest: A-Z Book Project
Create a picture dictionary for one of William Shakespeare's most famous plays. After readers finish The Tempest, they assign each letter of the alphabet to a concept or character, and add a description and evidence from the text to the...
Prestwick House
Analyzing Multiple Interpretations of Literature
There is a reason why an Oscar is given each year for the Best Adaptation Screenplay. Adaptations are the focus of an exercise that asks class members to compare a work of literature with a least one adaptation of the work into a...
Los Angeles County Office of Education
Assessment For The California Mathematics Standards Grade 6
Test your scholars' knowledge of a multitude of concepts with an assessment aligned to the California math standards. Using the exam, class members show what they know about the four operations, positive and negative numbers, statistics...
Curated OER
Crafty Literature Projects to Lure Language Arts Learners
Recognize National Arts and Crafts Month with language arts project ideas to inspire creative learning.
Statistics Education Web
Now You SeeIt, Now You Don't: Using SeeIt to Compare Stacked Dotplots to Boxplots
How does your data stack up? A hands-on activity asks pupils to collect a set of data by measuring their right-hand reach. Your classes then analyze their data using a free online software program and make conclusions as to the...
Statistics Education Web
10,000 Steps?
Conduct an experiment to determine the accuracy of pedometers versus pedometer apps. Class members collect data from each device, analyze the data using a hypothesis test, and determine if there is a significant difference between the...
Curated OER
Mathematical Modeling
Study various types of mathematical models in this math lesson plan. Learners calculate the slope to determine the risk in a situation described. They respond to a number of questions and analyze their statistical data. Then, they...
Curated OER
Tortoise and Hare Races
Practice basic map skills with the story of The Tortoise and the Hare. After listening to the story, class members create a map that indicates the starting line, the path the animals took, where they stopped to rest, and the finish line....
Stillwater Central School District
The Adventures… Of Alice in Wonderland
Go down the rabbit hole with a thorough novel unit for Lewis Carroll's Alice in Wonderland. With a cause and effect chart, K-W-L organizer, and reading comprehension questions, the resource is a great addition to your summer assignments...
Hampton-Brown
Esperanza Rising
Accompany a reading of the novel, Esperanza Rising by Pam Muñoz Ryan, with a series of lessons that dive deep into the literary world of a young girl and the journey she takes to start a new life. Lessons and their...
Teach Engineering
Understanding the Air through Data Analysis
Is there a correlation or causation relationship between air pollutants? Groups develop a hypothesis about the daily variation of air pollutants, specifically ozone and CO2. Using Excel to analyze the data, the groups evaluate their...
Blake Education
Harry Potter and the Philosopher’s Stone
The motto for Hogwarts School of Witchcraft and Wizardry warns that one should never tickle a sleeping dragon, but learners will definitely be tickled by the activities in a packet of materials designed to accompany a reading of the...
Other popular searches
- Plot Summary Organizer
- Plot Summary Diagram
- Write a Plot Summary
- Oedipus Plot Summary
- Plot Summary Book Reports
- Teaching Plot Summary
- Language Arts Plot Summary
- Plot Summary Handouts
- Plot Summary Worksheet


