Curriculum Corner
7th Grade ELA Common Core Checklists
Track your class's progress on all of the ELA Common Core standards with these handy charts. Along the left side, each seventh grade identifier is listed along with the full text of the standard. As you teach, reteach, assess, and...
Statistics Education Web
Did I Trap the Median?
One of the key questions in statistics is whether the results are good enough. Use an activity to help pupils understand the importance of sample size and the effect it has on variability. Groups collect their own sample data and compare...
Curated OER
A Closer look at Oil and Energy Consumption
Upper graders analyze basic concepts about the consumption, importation and exportation of the worlds oil production. They create several graphs to organize the data and draw conclusions about the overall use of oil in the world.
Curated OER
The Study of Theme and Figurative Language in Poetry and/or Prose
Identify and analyze the use of figurative language used in select pieces of writing. These pieces of literature will represent at least two pieces by one writer and at least two pieces by different writers. This lesson plan would be a...
Curated OER
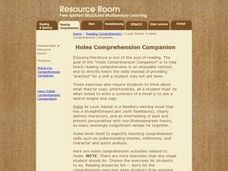
Holes Comprehension Companion
Here is a one-stop planning resource for Louis Sachar's Newbery Award-winning book Holes. You'll find 21 links to worksheets and various activities designed to span the entire book. Learners draw to help analyze settings and make...
Curated OER
Setting the Story: Techniques for Creating a Realistic Setting
“It was a dark and stormy night.” Thus begins the 1830's novel Paul Clifford and, of course, all of Snoopy’s novels! Encourage young writers to craft settings for their stories that go beyond Edward Bulwer-Lytton’s often-mocked phrase...
Utah Education Network (UEN)
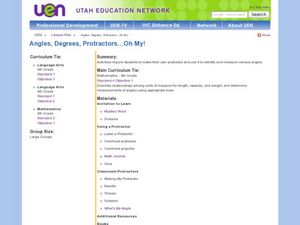
Angles, Degrees, Protractors . . . Oh My!
Fourth and fifth graders make a protractor and identify various angle types. In this protractor and angle lesson, learners make their own protractor and use it to measure a variety of angles. They complete worksheets while identifying...
Curated OER
Connotation and Denotation: How Word Choice Affects a Paragraph
Review the terms denotation, connotation, diction, and mood in paragraph writing. After defining the terms, middle schoolers practice writing examples of both connotation and denotation. They complete a connotation and denotation graphic...
Curated OER
Analyzing Literary Devices
Eighth graders identify figurative language and poetry in this literary analysis lesson. Using Through the Looking Glass by Lewis Carroll and a YouTube video for "The Walrus and the Carpenter," young readers complete a literary device...
Miami University
Chapter Nine Worksheet: Monopoly
Advanced economics pupils analyze a series of graphs, data sets, and profit scenarios all related to monopolies and marginal revenue. They read through the background information, complete a graph using the data provided, and justify...
Teach Engineering
Can You Resist This?
Some things are hard to resist. Small collaborative groups build circuits and calculate the voltage using Ohm's Law. Budding engineers explore the connection between the voltage across different resistors and linear functions with...
Curated OER
Using Vegetation, Precipitation, and Surface Temperature to Study Climate Zones
Using NASA's Live Access Server, earth scientists compare the temperature, precipitation, and normalized difference vegetation index for four different locations. They use the data to identify the climate zone of each location using...
ARKive
Temperate Rainforest in the Pacific Northwest
Explore the amazing temperate rainforest of the Pacific Northwest. Your class starts by investigating the animals and plants of the Northwest, specifically Washington, and then research an animal population common to the area. In small...
Curated OER
Drive the Data Derby
Three days of race car design and driving through the classroom while guessing probability could be a third graders dream. Learn to record car speed, distances traveled, and statistics by using calculation ranges using the mean, median,...
Teach Engineering
Linking Sources and Pollutants
Class members use an air quality monitor to measure the amount of gas-phase pollutants emitted by different sources. Groups choose three different sources and make predictions about what the monitors will detect. Teams then expose the...
Teach Engineering
Combustion and Air Quality: Emissions Monitoring
Help your class determine the types of pollutants coming from vehicle exhaust. Groups use an air quality monitor to determine the emissions from different vehicles, to gain knowledge about combustion energy, and to predict how the...
Teach Engineering
Graphing Equations on the Cartesian Plane: Slope
Slopes are not just for skiing. Instructors introduce class members to the concept of slope and teach them how to calculate the slope from a graph or from points. The lesson plan also includes the discussion of slopes of parallel and...
NOAA
Tracking a Drifter
Be shore to use this drifter resource. The third installment of a five-part series has learners using the NOAA's Adopt-a-Drifter website to track to movement of a drifter (buoy) in the ocean. Graphing the collected data on a map allows...
Statistics Education Web
Population Parameter with M-and-M's
Manufacturers' claims may or may not be accurate, so proceed with caution. Here pupils use statistics to investigate the M&M's company's claim about the percentage of each color of candy in their packaging. Through the activity,...
Teach Engineering
Air Pollution in the Pacific Northwest
Scholars investigate levels of nitrogen dioxide in the Pacific Northwest by examining the role of nitrogen in air pollution and how remote sensing can be used to measure nitrogen levels. An Excel spreadsheet calculates the difference...
Teach Engineering
Accelerometer: Centripetal Acceleration
Scholars build robotic arms that swing back and forth and use them to collect velocity and acceleration data. To analyze the results, pupils compare data to the equations for angular velocity and centripetal acceleration.
Teach Engineering
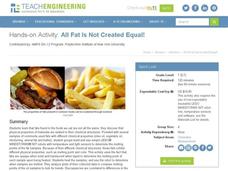
All Fats Are Not Created Equal
Apply robotics to connect physical properties to chemical properties. Future engineers use robots to determine the melting points of various fats and oils. The robots can do this by measuring the translucency of the fats as they heat up.
Teach Engineering
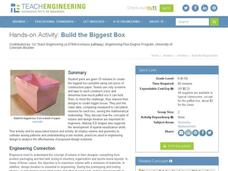
Build the Biggest Box
Boxing takes on a whole new meaning! The second installment of the three-part series has groups create lidless boxes from construction paper that can hold the most rice. After testing out their constructions, they build a new box....
West Jefferson High School
The Novel — Honor
For classes tackling To Kill a Mockingbird, this lesson plan sets readers up for discussions or essay writing with questions and prompts. The prompts encourage individuals to explore beyond the novel itself, looking at photographs from...
Other popular searches
- Plot Summary Organizer
- Plot Summary Diagram
- Write a Plot Summary
- Oedipus Plot Summary
- Plot Summary Book Reports
- Teaching Plot Summary
- Language Arts Plot Summary
- Plot Summary Handouts
- Plot Summary Worksheet


