Curated OER
Data Displays with Excel
Students collect and analyze data. In this statistics lesson, students display their data using excel. They plot the data on a coordinate plane and draw conclusion from their data.
Curated OER
Graphing X, Y, Z
Seventh graders explore how proportion controls the image of a drawing. They examine a coordinate plane and discuss plotting. Student experiment drawing an object one size, and then drawing an identical object on a different scale.
Curated OER
Coordinates
Fourth graders explore plotting on a coordinate plane. They visit a given website and play a game called, "Billy Bug." Students use coordinates to guide the bug to its food. Afterward, they complete follow-up problems to reinforce the...
Curated OER
Walking the Plank
This is a cool math activity. Kids collect and interpret data based on a physical act. A board is balanced between a scale and a step, learners record a peer's weight as it decreases while s/he walks further away from the scale. They...
Curated OER
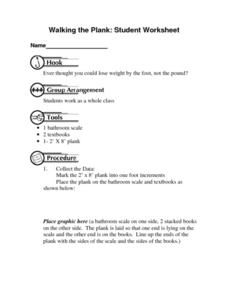
Walking the Plank: Student Worksheet
In this math worksheet, students will work in a group to experiment with the weight of objects when placed at a distance from a scale (using a plank). Students will record and graph their results.
California Education Partners
Science Fair Project
Plant the data firmly on the graph. Given information about the growth rate of plants, pupils determine the heights at specific times and graph the data. Using the information, scholars determine whether a statement is true and support...
Curriculum Corner
8th Grade Math "I Can" Statement Posters
Clarify the Common Core standards for your eighth grade mathematicians with this series of classroom displays. By rewriting each standard as an achievable "I can" statement, these posters give students clear goals to work toward...
Curated OER
The Sum of Our Integer Intelligences
Young mathematicians explore integers. They review adding integers through engaging in mathematical labs. Each lab station is designed to reflect one of the multiple intelligences. Resources for all activities are provided.
Curated OER
Learn How to Graph
Students examine various types of charts and discover how to construct a line graph. Using graph paper, they construct a graph displaying weight loss over a five-year period. They draw copnclusions from the completed graphs.
Curated OER
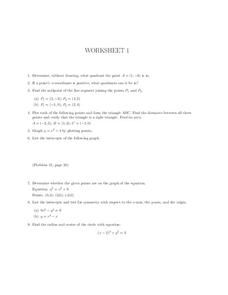
Worksheet 1, Coordinate Graphing
In this algebra worksheet, students determine the quadrant a given point is in. They find the midpoints of two line segments. Students plot points to form a triangle and find the distance between points. Students find the area of the...
Curated OER
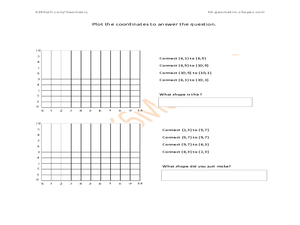
Plot the Coordinates
In this plotting coordinates worksheet, learners plots sets of coordinates on graphs, then identify the shape the connected points have created. A reference web site is given for additional activities.
Curated OER
Plotting Coordinates
In this coordinates worksheet, students plot sets of coordinates, connected them and creating letters. A reference web site is given for additional activities.
Curated OER
Angles in Standard Positions
Students identify positive and negative angles using the Unit Circle. In this pre-calculus lesson, students identify the different angles on a unit circle using the coordinate plane and the four different quadrants as a guide. They...
Curated OER
Basic Algebra and Computers: Spreadsheets, Charts, and Simple Line Graphs
Students, while in the computer lab, assess how to use Microsoft Excel as a "graphing calculator." They view visual representations of line graphs in a Cartesian plane while incorporating basic skills for using Excel productively.
Curated OER
Distance Formula
Students watch teacher demonstration of distance formula, view non-collinear cities on maps, plot points on coordinate plane, evaluate square roots, compute distance between two points, and use Heron's formula to find area of triangles.
Curated OER
Analytic Geometry
In this analytic geometry worksheet, 9th graders graph and solve 13 different types of problems that include determining whether equations are linear to matching given equations to their corresponding equation in the second column....
Curated OER
Statistics
In this statistics worksheet, students view 6 graphs to determine the correlation. Students then answer 4 questions that involve plotting data, determining a relationship, and making predictions.
Curated OER
Integration: Statistics, Scatter Plots and Best-Fit Lines
In this math worksheet, students identify the type (if any) of correlation on 6 scatter plots. They use information given on a table to create a scatter plot and identify the type of correlation. Students use the scatter plot to make...
Curated OER
Make a Design by Plotting Points
Students plot points on graph paper to make designs. They color their designs.
Curated OER
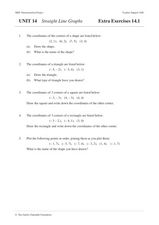
Straight Line Graphs
In this algebra instructional activity, students graph coordinate pairs on a coordinate plane. They match points with letters and graph a line through all the plotting to create a straight line. There are 25 questions with an answer key.
Curated OER
Solving Systems by Graphing
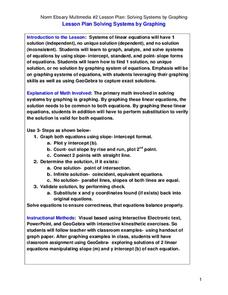
Students solve systems of equation through graphing. In this algebra lesson, students solve linear equations and analyze the result to figure out if there is one solution, no solution or infinitely many solutions. They graph their lines...
Curated OER
Human Face of Mathematics - Mathematics in Aboriginal Culture
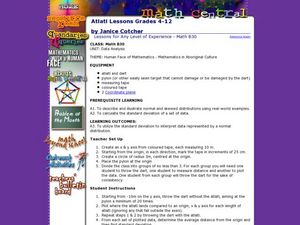
Young scholars collect statistical data. In groups, students play a dart game and then determine the distance between darts. They collect the data and plot the information on a coordinate plane. They identify the mean and the standard...
Curated OER
Exploring Transformations
Young scholars investigate functions and their transformations. They move absolute value functions around on the coordinate plane, and then define the transformation and plot the new graph. The table feature of the TI-calculator is used...
Curated OER
Linear Equations in Our Every Day World!
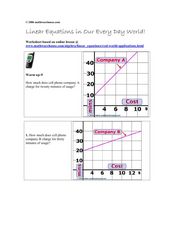
In this linear equations learning exercise, students read and interpret graphed linear equations. They read a story problem, write a linear equation, and plot the points on a coordinate plane. This five-page learning exercise cotnains...


