Curated OER
Coordinate Connections
Sixth graders complete several activities that involve coordinates and graph paper. They visualize and identify geometric shapes after applying transformations on a coordinate plane. Finally, 6th graders draw and label a coordinate...
Curated OER
Coordinating Coordinates
Third graders explore coordinate pairs and coordinate grids. They use a grid on which each letter of the alphabet is assigned a coordinate pair, 3rd graders decipher a coded message. Pupils compare coordinate pairs on a coordinate grid...
Curated OER
Linear Inequalities
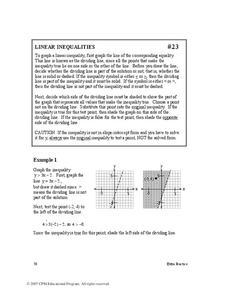
In this linear inequalities worksheet, students solve and graph systems of inequalities on a coordinate plane. Examples and explanations are provided. This five-page worksheet contains 32 problems. Answers are provided at the end of...
Curated OER
Slope
Students calculate the slope of a line. In this slope lesson, students use a graph, an equation or two points to help them calculate the slope of a line. They differentiate between a slope of zero and an undefined slope.
Curated OER
Geometry and Geoboard
Sixth graders use geoboards and dot paper to experiment with geometric concepts. In this geometry lesson, 6th graders complete four activities using geoboards or dot paper including naming points on a coordinate plan and finding the area...
Curated OER
Writing Linear Equations
For this linear equations worksheet, 9th graders solve and complete 12 different problems that include writing the equations in point-slope and standard forms. First, they write the standard form of an equation that passes through the...
Curated OER
Slope
In this slope learning exercise, students solve and complete 26 various types of problems. First, they find the slope of each line illustrated on the grid. Then, students find the slope of the line through each pair of points. In...
Curated OER
Shell Graphing
Fifth graders explore the four quadrants of a coordinate grid. In this graphing lesson, 5th graders trace sea shells in each of the four quadrants of a coordinate grid and then label the ordered pairs on each shell. For the final...
Math Mammoth
Slope; Math Mammoth.com
For this math activity, students find the slope of four lines when they are drawn on a coordinate grid. Students are given the slope and draw the line for two lines. They use the slope formula to find slope when given two points on a...
Curated OER
Unit 14 - Loci and Transformations
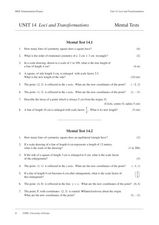
In this transformations worksheet, students solve 25 short answer problems. Students dilate, reflect, and translate points and figures in the coordinate plane. Students determine scale factors and lines of symmetry of figures.
Curated OER
Regents Exam Questions: Distance
In this distance worksheet, students solve 12 multiple choice, short answer, and graphing problems. Students use the distance formula to find the distance between two points.
Curated OER
Slope and Intercept
In this slope and intercept worksheet, 10th graders solve 10 different problems that include the graphs of various forms of linear equations. First, they determine the slope of a line given the equation. Then, students determine if the...
Curated OER
Slope
In this slope worksheet, 9th graders solve and complete 18 different problems that include identifying various points on a graph. First, they determine the slope of each line drawn on the grid to the right. Then, students determine the...
Curated OER
Graphing Lines
In this graphing lines worksheet, students graph lines that are in the point-slope form. They identify the y-intercept and the slope. They graph the equation of a line on a coordinate plane. This four-page worksheet contains 12...
Curated OER
Transforming Triangles
Sixth graders graph translations (slides) and reflections (flips) on a coordinate plane. They visualize and identify geometric shapes after applying transformations on a coordinate plane. Finally, 6th graders write a paragraph telling...
Curated OER
Simple Machines - Museum of Science and Industry
In this museum student guide worksheet, students make a mini-book about simple machines to be used during a visit to the Museum of Science and Industry. They locate the exhibits that demonstrate the wedge, inclined plane, screw, lever,...
Curated OER
Coordinate Plotting: Shapes
In this math instructional activity, students graph ordered pairs on a coordinate grid. They connect the points to create a geometric shape. This instructional activity generator allows teachers to select the size of the grid, the...
Curated OER
Graphing Solutions
In this graphing solutions worksheet, 9th graders solve 13 various types of problems. First, they find the solution of each systems by graphing on the coordinate plane provided. Then, students solve each systems of equations...
Curated OER
Congruence Statements
In this congruence statements worksheet, 10th graders solve and complete 16 various types of problems. First, they complete each congruence statement listed. Then, students graph each set of points on the coordinate plane provided. They...
Curated OER
Using Tables
In this using tables worksheet, 9th graders solve and complete 10 various types of problems that include using tables to determine information. First, they write an equation to determine the total amount. Then, students define each of...
Curated OER
Circles Terminology Multiple Choice
In this circles activity, high schoolers solve 10 multiple choice problems. Students answer questions about diameter and chord relationships, tangent lines to a circle, circumference, the Pi relationship, etc.
Curated OER
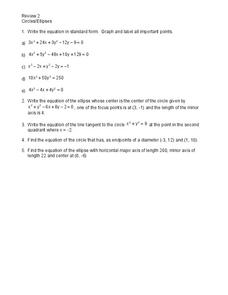
Circles and Ellipses
In this circles and ellipses worksheet, students solve and complete 5 different types of problems. First, they write each equation in standard form. Then, students graph and label Write the equation of the ellipse whose center is the...
Curated OER
Functions and Graphing
Graphing functions in a real world application makes math come to life. Learners graph points on a coordinate plane and identify various points on a graph by working through a set of real world problems. This is a perfect review exercise.
Curated OER
Learn How to Graph
Students examine various types of charts and discover how to construct a line graph. Using graph paper, they construct a graph displaying weight loss over a five-year period. They draw copnclusions from the completed graphs.


