Curated OER
Data Collection - Primary Poster
Students explore the concept of collecting, analyzing, and graphing data. In this collecting, analyzing, and graphing data lesson, students create a survey about a topic of interest. Students poll their classmates, analyze, and graph...
Curated OER
Magnetic Polls
Students explore the New Hampshire primaries and the polling process by analyzing polling information, examining the effects of polls, and creating graphs that represent polling data.
Curated OER
Quick Stats with Quick Poll
Learners analyze data using bar graphs and the TI in this statistics lesson. They investigate quick polls and graph the data using different properties of statistics. This assignment requires a TI Navigator.
Curated OER
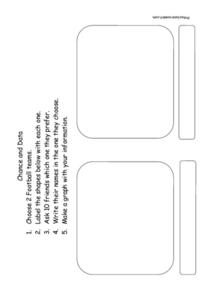
Chance and Data
In this graphing a survey activity, learners poll 10 friends to see which of 2 football teams is their favorite and then graph their data results.
Willow Tree
Box-and-Whisker Plots
Whiskers are not just for cats! Pupils create box-and-whisker plots from given data sets. They analyze the data using the graphs as their guide.
Carolina K-12
The Results are In! Examining Our First Vote Election
The 2016 election is over, and now it's time to dig in to some data! An activity revolves around data gathered from the First Vote Project in North Carolina wherein thousands of students voted. After diving in to the data using...
Curated OER
Poll Positions
Students analyze and graph the results of a nationwide New York Times poll about race in the United States. They poll people in their community regarding their views and experiences, and compare and contrast local and national poll data.
Balanced Assessment
Presidential Popularity
Media often misrepresent data and statistics to their advantage. This lesson asks scholars to analyze an article with misleading statistics. They use margin of error and mean data in their studies. Once they complete their analysis,...
College Board
Sampling Distributions
The validity of data depends on the strength of the sample. A collection of instruction and activities focuses on sampling distributions and the analysis of that data. Scholars learn about distribution tests such and Central Limit...
Curated OER
Voter Turnout
Explore politics by analyzing the voting process. Pupils discuss the purpose of casting votes in an election, then examine graphs based on the data from a previously held election's turnout. The lesson concludes as they answer study...
EngageNY
Events and Venn Diagrams
Time for statistics and learning to overlap! Learners examine Venn Diagrams as a means to organize data. They then use the diagrams to calculate simple and compound probabilities.
Curated OER
Being an Educated Consumer of Statistics
Young scholars examine kinds of data used to report statistics, and create their own statistical report based on any of the four sources of media information (Internet, newspaper, TV, magazine).
Curated OER
Creating Graphs from Tables
Students interpret data from tables and then create a graph to show the same data in a different organization.
Curated OER
Using Extrapolations
In this using extrapolations worksheet, 6th graders use data analysis to answer nine questions about data prediction and extrapolation.
Curated OER
Election Poll, Variation 2
When a random sample isn't enough, your math class can compare the data from a physical simulation to decide if the probability is still likely. The lesson is part of a probability series that focuses on one question and different ways...
Curated OER
Taking Poll Information
Students investigate the election and poll surveys. In this statistics lesson, students take poll information and analyze the data. They graph their data and make predictions and conjectures.
Curated OER
Polling and Statistics
Pupils investigate polling. In this statistics lesson, students collect data-on polling and graph their data on a coordinate plane. They identify biased and non-biased polling.
Curated OER
Qualitative and Quantitative Data
Seventh graders study the different ways that they have been evaluated over the years. In this qualitative and quantitative lesson students complete a learning activity while in groups.
EngageNY
Estimating Probability Distributions Empirically 1
What if you don't have theoretical probabilities with which to create probability distributions? The 11th installment of a 21-part module has scholars collecting data through a survey. The results of the survey provide empirical data to...
EngageNY
Conditional Relative Frequencies and Association
It is all relative, or is it all conditional? Using an exploration method, the class determines whether there is an association between gender and superpower wish through the use of calculating conditional relative frequencies. The...
Curated OER
Amnesty: More Than a Word
Young scholars explain how the use of certain emotive terms affects voter's perceptions. Students assess how word choice by political parties can changes our thinking on a subject. After viewing ads by the two political parties, young...
Curated OER
Voter Fraud: Are Ghosts Going To The Polls
Students research background material about voting in their community. They interview local/county election officials to see what is going on in the community. They also interview teachers, and students to determine if they are newly...
Curated OER
Opinions, Please!
Students discuss the meaning and purposes of polls and surveys. After reading an article, they analyze the results of a poll given to residents of New York City. They create a survey of their own and analyze the data to write a written...
Social Media Toolbox
Social Media Survey
Survey says ... social media is here to stay! How do the pupils in your school use social media? Using lesson four from a 16-part series, The Social Media Toolbox, learners study surveys and create their own. The resource includes...


