Virginia Department of Education
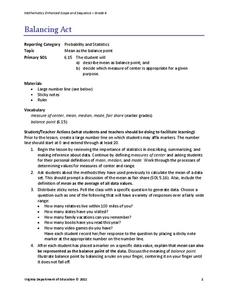
Balancing Act
How many different interpretations of the mean are there? Scholars place numbers on a number line and determine the mean. They interpret the mean as the average value and as the balance point.
Curated OER
Graphing Favorite Fruit
Third graders take poll and sort data, enter the data to create a spreadsheet and create bar and pie graphs.
Curated OER
Voting And Elections
Students examine the voting practices of the past several presidential elections while using data to determine the influence of different factors. They identify the reasons for high or low voter turnout and then display the outcome of...
Curated OER
A Charming Graph
In this a charming graph worksheet, students poll at least ten people to ask each one what their favorite charm is and then graph their data.
EngageNY
Sampling Variability in the Sample Proportion (part 1)
Increase your sample and increase your accuracy! Scholars complete an activity that compares sample size to variability in results. Learners realize that the greater the sample size, the smaller the range in the distribution of sample...
Curated OER
The Old Electoral College Try
Students examine defining issues in the race for the White House and evaluate important issues in several of the swing states. They create and administer a poll in their community and make predictions by analyzing the data.
Constitutional Rights Foundation
U.S. Immigration Policy and Hitler’s Holocaust
Though the Statue of Liberty welcomes political refugees to her shores, the welcoming sentiment has not always been reflected in the American citizenry. High schoolers read about the regrettable period in United States history...
Curated OER
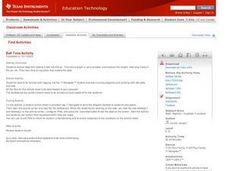
Ball Toss Activity
Pupils collect data from tossing a ball into the air. Using a data collection device, they graph the data, set a window, and analyze the height of the toss, how long the ball was in the air, etc. They then find an equation that models...
Curated OER
Parents And Alcohol: Who's To Blame
Learners explore the topic of underage drinking. They find a focus and write a news feature/analysis that reports on what the community is doing to prevent underage drinking and some assessment of the extent of the problem.
Curated OER
Opinion Surveys
Students examine the factors that affect the accuracy of opinion surveys. They calculate probability and chance using data they have collected. They practice reading tables and graphs as well.
Curated OER
Let's Take a Chance!
Students investigate probability and the chance of an even happening. In this algebra lesson, students incorporate their knowledge of probability to solve problems and relate it to the real world. They learn to make decisions based on data.
Curated OER
The Immigrants of Brooklyn: Now And Then
Students compare the immigrant population during the pre-Civil War era (1855) to that of today (2000 census data). They interpret circle and bar graphs comparing immigrant populations in Brooklyn yesterday and today, and create a class...
Curated OER
Skittles, Taste the Rainbow
Fifth graders learn and then demonstrate their knowledge of a bar and a circle graph using the classroom data. Students are given a pack of skittles candy. Students create a bar and circle graph indicating the results of the contents of...
ProCon
Police Body Cameras
Should police officers wear body cameras? Scholars consider the question as they use the resource to conduct independent research about the debate topic. They read a brief background and peruse the main pros and cons about the issue....
Curated OER
Do You Like to Spend or Save?
Students, after briefly discussing spending and saving habits, take a poll to see how their peers like to manage money. Then students graph their findings and discuss the survey results.
Curated OER
My Favorite Book Survey
For this my favorite book survey worksheet, students survey their classmates to find out what books they enjoyed reading the most during the year. Students record their choices and keep tally marks on their data.
Curated OER
Wordle It
Students discuss, define, and give themselves character traits. In this character traits lesson, students create a list of ten character traits that describe themselves. Students create a data table and poll their classmates about the...
Annenberg Foundation
Student Voices
Whether it's an election year or not, a unit on voting patterns and political campaigns will awaken the civic pride in your high school citizens. Divided into six parts, the curriculum covers various facets of an election, including...
Curated OER
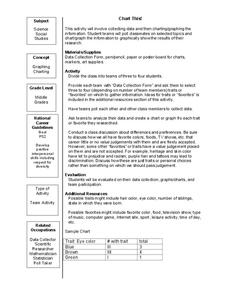
Chart This!
Students collect data and graph or chart the information. In this data organization lesson, students poll their classmates about certain topics and chart or graph the information to show the results of their research.
Curated OER
Database Detectives Record Clues
Students collect and organize data from their classmates. They create a database of the information and analyze it. They discuss the role technology has in the world today.
Curated OER
Bird Bulletins
Young scholars, in groups, create a survey to investigate how much their community knows about birds. They graph their findings using a bar graph. Using the data collected, they develop an advertising campaign to increase community...
Curated OER
Constitutional Amendments Survey
Students conduct Constitutional Amendments Survey to create an opinion poll forum.
Curated OER
House Bill No. 4097
Students identify healthy and unhealthy foods while considering a bill that would ban certain foods in schools. Through survey and discussion, they discuss a proposed legislative bill that would ban certain types of food in schools....
Curated OER
The Election Connection
Students participate in a mock election. In this election lesson plan, students vote online in a mock election, graph the results, and compare their results to the nationwide results.


