Curated OER
Etc: Maps Etc: Distribution of Population , 1850
A map of the United States showing the population distribution in 1850. The map is coded to show population densities ranging from under 2 inhabitants per square mile to over 90 inhabitants per square mile. The map illustrates the...
Curated OER
Educational Technology Clearinghouse: Maps Etc: Distribution of Population, 1790
A map of the original thirteen States in 1790 showing State lines, territories northwest and south of the Ohio River, British and Spanish possessions, and the distribution of the European-American population east of the Mississippi River...
Curated OER
Etc: Maps Etc: Population of South America, 1898
A base map from 1898 of the population density and general ethnic make-up of South America.
Other
Just Maps: World Maps
An index of maps and flags of countries throughout the world. Also provides political maps, time zones, population, and religious maps of every region of the world.
Better Lesson
Better Lesson: Mars Habitat
In this lesson, students are asked to examine a model for a space station on Mars that will house six researchers studying the possibility of establishing a colony. Given the dimensions of the station and the minimum amount of space...
Other
El Diario Informacion General De Bolivia
This site is a reference to vital statistics and other data about the country of Bolivia. General information on the history, government, environment, and tourism of Bolivia are also provided. Illiteracy rate, average number of years of...
Curated OER
University of Texas: Iran: Country Profile
This wall map of Iran from the Perry-Castaneda Collection is comprised of seven individual maps showing many aspects of Iran. Clicking on the individual map will enlarge it for your perusal. You can also click on the text to see a brief...
Science Education Resource Center at Carleton College
Serc: Exploring Air Quality in Aura No2 Data
This activity illustrates how data can be imported into Google Earth for visualization and interpretation. Students are introduced to air quality as it relates to population density and topography.
Travel Document Systems
Tds: Malawi: Geography
See how the Great Rift Valley and Lake Malawi dominate Malawi's geography. Read about the climate, terrain, and population density. Information is from the U.S. State Dept. Background Notes.
Other
Virginia Places: What Determines the Boundaries of a Region in Virginia?
Although this site talks about regions in Virginia, it offers excellent information on regions in general, for example, ways regions might be classified; e.g., by population density, geology, watershed, ecosystem, economy,...
Curated OER
Educational Technology Clearinghouse: Maps Etc: Density of Population, 1898
A map from 1898 showing the density of population in the contiguous 48 states at the time. The map is coded to show areas of density ranging from sparsely populated to areas of dense population. "The eastern half of the United States...
Curated OER
Etc: Maps Etc: Density of Population in Europe, 1901
Map showing density of population in Europe.
Curated OER
Educational Technology Clearinghouse: Maps Etc: Density of Population, 1915
Density of population throughout North America.
Curated OER
Etc: Maps Etc: Population Distribution of China, 1971
A map from 1971 showing comparative population distribution patterns of China and the United States. The map illustrates the terrain barriers to population development in China, and the trend to dense populations along the coast and...
Curated OER
Educational Technology Clearinghouse: Maps Etc: Population Distribution, 1870
A map from 1907 of the United States showing the distribution of the population in 1870. The map is keyed to show areas of population with densities ranging from under 2 inhabitants per square mile to 90 and over inhabitants per square...
Curated OER
Etc: Maps Etc: Population in the United States, 1900
A map from 1910 of the United States showing the distribution of the population in 1900. The map is keyed to show areas of population with densities ranging from under 2 inhabitants per square mile to 90 and over inhabitants per square...
Curated OER
Educational Technology Clearinghouse: Maps Etc: Distribution of Population, 1880
A map of the United States showing the distribution of the population in 1880. The map is keyed to show areas of population with densities ranging from under 2 inhabitants per square mile to 90 and over inhabitants per square mile.
Curated OER
Etc: Maps Etc: Population Distributions in Africa, 1920
A map from 1920 of Africa and Madagascar showing the population distribution in the region, keyed to show densities ranging from under 2 persons per square mile to over 250 persons per square mile.
Travel Document Systems
Tds: Malta: People
Take a look at the people who live in Malta who have been influenced by many waves of cultures over the years. A chart gives some quick facts about the population. Information from the CIA World Fact Book.
American Institute of Biological Sciences
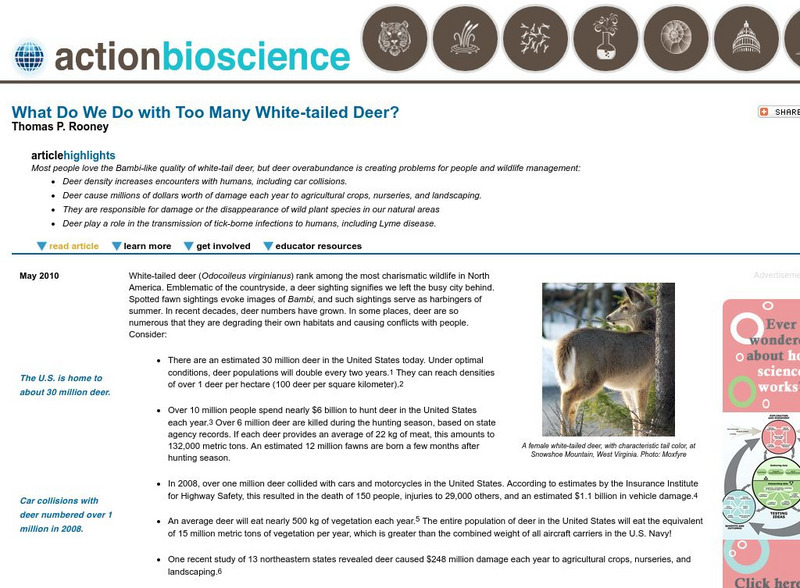
Action Bioscience: What Do We Do With Too Many White Tailed Deer?
The rise in deer population is putting the animals in the way of harm from increased car accidents, damage to agricultural businesses as well as wildlife plant species, and ticks that cause things like Lyme disease. Take a look at...
Other
Online Conversion
Conversion calculators galore! Convert just about anything from one measureable unit into another measureable unit here with over two dozen calculators. Each of the links is specific to a measureable quantity. Some examples include...
Biblioteca Virtual Miguel de Cervantes
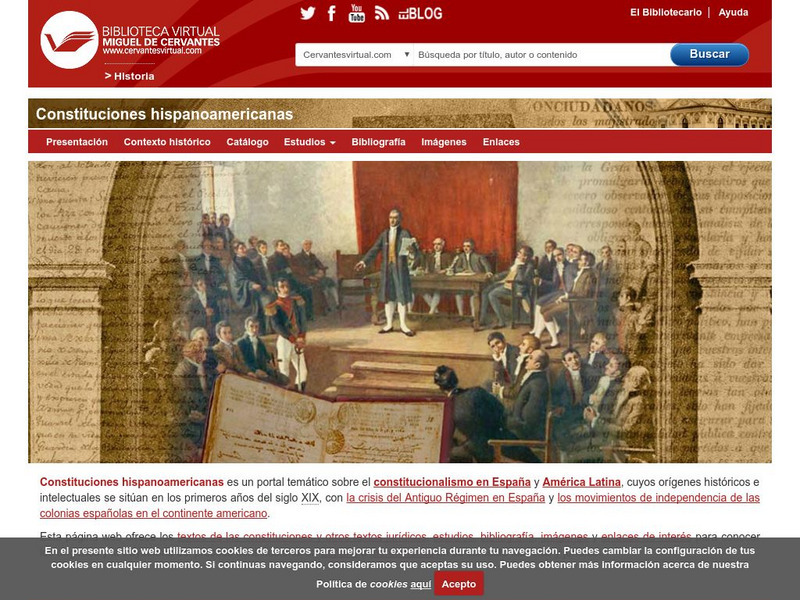
Constituciones Hispanoamericanas
Fascinating comparison of Spanish-speaking countries. Includes the flag and a general map of each country. Statistical data is provided for each country. Constitutional and government information is available for each country.
Northern Illinois University
Tagalog: Philippine Geography
This website gives a great lesson plan for helping to understand the geography and physical environment of the Philippines. Map and map quiz are included.
United Nations
United Nations Cyberschoolbus: Cities of Today, Cities of Tomorrow
The six teaching units of this site provide an overview of urbanization, its history, its potential, its problems. The site has lots of activities, and a game.
Other popular searches
- Population Density Maps
- Human Population Density
- Geography Population Density
- Comparing Population Density
- Biology Population Density
- Us Population Density
- Population Density in Mali
- Population Density of Cinda
- Population Density of Cina
- Animal Population Density
- Population Density Problems
- Population Density in Canada


