Howard Hughes Medical Institute
Patterns in the Distribution of Lactase Persistence
We all drink milk as babies, so why can't we all drink it as adults? Examine the trend in lactase production on the world-wide scale as science scholars analyze and interpret data. Groups create pie charts from the data, place them on a...
Radford University
The Science of Surveys
To drill or not to drill? An informative unit has scholars first research the advantages and disadvantages of oil drilling in Alaska. They set up and conduct a sample survey to assess attitudes toward oil drilling in a specific...
Illustrative Mathematics
Why Randomize?
Your statisticians draw several samplings from the same data set, some randomized and some not, and consider the distribution of the sample means of the two different types of samplings. The exercise demonstrates that non-random samples...
Curated OER
Reading the River
In collaborative groups, young ecologists measure the temperature, pH, and dissolved oxygen for three different freshwater samples. They examine each sample with a microscope and record observations on the microorganisms in the pond...
Curated OER
Capture/Recapture
Learners use proportions to estimate the size of populations. They describe the data with using a graph or table of the estimate. Students use descriptive statistics to calculate mean, median, and mode. They also compare and contrast an...
Curated OER
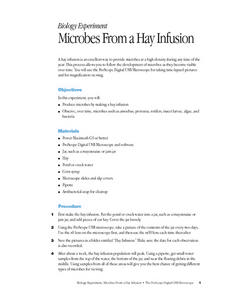
Microbes From a Hay Infusion
Students observe, over time, microbes such as amoebas, protozoa, rotifers and insect larva. They create a hay infusion culture using pond water then sample and record organisms found over a two week period.
Curated OER
First Amendment and the Future
Students read the Knight report and discuss key findings before deciding what aspects of the findings students can replicate in their own school and conduct a survey. They write survey questions and test them on sample group before...
Curated OER
Introducing The Cariboo Gold Rush
Students demonstrate appreciation of contributions of Aboriginal peoples, the French, and the British to the development of Canada and explain how supply and demand are affected by population and the availability of resources. They then...
Curated OER
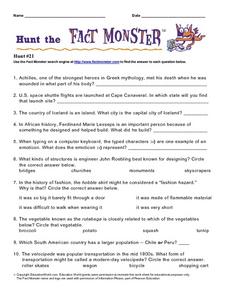
Hunt the Fact Monster Hunt #21
In this internet research worksheet, students answer ten unrelated questions by using the Fact Monster search engine. A sample question asks: "Achilles, one of the strongest heroes in Greek mythology, met his death when he was wounded in...
Curated OER
Wildlife Burrows
Burrowing animals are busy! Get your middle school ecologists busy as well by having them create a scale model of a burrowing population. They also design a PowerPoint or poster to explain their models.
Curated OER
One Square Meter
Learners explore the concept of a quadrat study. Students select and investigate a site and conduct a quadrat survey. They take measurements, observe the area and analyze their findings.
Curated OER
Freshwater Macroinvertebrates
Students identify and count Macroinvertebrates at a Hydrology website. In this macroinvertebrates lesson students collect, sort and identify Macroinvertebrates.
Curated OER
Prairie Restoration and Prairie Ecology
Students collect data as they identify and classify native prairie plants and insects. They create their own population study using a variety of sampling techniques to determine the population density of various species. Students...
Utah Education Network (UEN)
Probability and Statistics
MAD about statistics? In the seventh chapter of an eight-part seventh-grade workbook series, learners develop probability models and use statistics to draw inferences. In addition, learners play games and conduct experiments to determine...
EngageNY
Ruling Out Chance (part 1)
What are the chances? Teach your classes to answer this question using mathematics. The first part of a three-day lesson on determining significance differences in experimental data prompts learners to analyze the data by determining the...
Mathematics Vision Project
Module 8: Probability
It's probably a good idea to use the unit. Young mathematicians learn about conditional probability using Venn diagrams, tree diagrams, and two-way tables. They also take into consideration independence and the addition rules.
Rice University
Introductory Statistics
Statistically speaking, the content covers several grades. Featuring all of the statistics typically covered in a college-level Statistics course, the expansive content spans from sixth grade on up to high school. Material comes from a...
EngageNY
Types of Statistical Studies
All data is not created equal. Scholars examine the different types of studies and learn about the importance of randomization. They explore the meaning of causation and when it can be applied to data.
Howard Hughes Medical Institute
Measuring Biodiversity in Gorongosa
Take your biology class' understanding of biodiversity to a whole new level! Ecology scholars use data to calculate three different diversity indices based on the organisms in the Gorongosa National Park. The four-part activity uses an...
Federal Reserve Bank
Gini in a Bottle: Some Facts on Income Inequality
Delve into the hard numbers and fundamental concept of income inequality in the United States, using graphs, detailed reading materials, and an organized learning exercise.
West Liberty Community School District
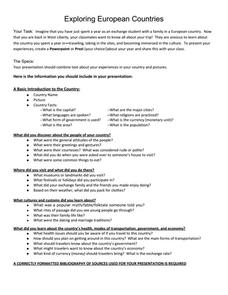
Exploring European Countries
Your class members will each explore a European country of their choice and report back to the class using a creative PowerPoint or Prezi. They will not only include a basic introduction to the country, but also what they discovered...
Paul Hamlyn Foundation
Work That Matters: The Teacher’s Guide to Project-Based Learning
Whether new to inquiry-based learning or experienced with its protocols, you'll find much to value in High Tech High's comprehensive guide to project-based learning. Designed for educators, the guide has everything instructors need to...
Curated OER
Benthic Macroinvertebrates
Learners survey and describe a stream ecosystem. They sample the benthic macroinvertebrate populations of a given stream and determine community structure through the use of the Chandler Index and a species diversity index.
Curated OER
Oregon Cities
Young scholars research one 20th century Oregon city, focusing on its population changes and the reasons for the changes. They write an expository essay which includes graphs/charts.
Other popular searches
- Random Sampling Population
- Population Sampling Quadrat
- Sampling Animal Population
- Population Sampling Qua Drat
- Population Sampling Quiz
- Sampling Population
- Bat Population Sampling
- Natural Population Sampling
- Population Sampling Marine
- Science Sampling Population


