Curated OER
Butterfly Adventure
Students in second grade are paired with fifth grade computer research buddies. They observe the characteristics of caterpillars, and identify the four stages of the caterpillar to butterfly life cycle. They graph the number of...
Alabama Learning Exchange
Are We Finished with It Yet?
Learners recognize the importance of natural resources and that we need to conserve, reuse and recycle them. In this conserving natural resources lesson, students are given one object and must create something with it. Young scholars...
Curated OER
Food Pyramid
Third graders examine healthy eating habits by identifying the food pyramid. In this personal health lesson, 3rd graders discuss their own eating habits and how there should be a variety of foods in all diets. Students research an...
Curated OER
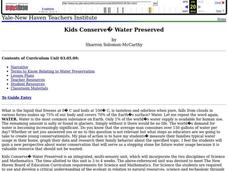
Kids Conserve? Water Preserved
Students study conservation and how cities obtain their water. In this water instructional activity students view a PowerPoint presentation and draw a picture of the water cycle.
Curated OER
A Good Story
Learners explore the contributions of philanthropists. In this philanthropy lesson, students watch "The Gift of All: A Community of Givers." Learners then read biographies of philanthropists and create PowerPoint presentations about the...
Curated OER
Career Connections
Students research information to create a career projects where technological skills will be utilized. In this career projects lesson, students create a project relating to a selected career of personal interest.
Curated OER
Presentation of Our Family
Although there is no real lesson plan included here, you could easily recycle the idea! Get kids using vocabulary related to family, age, feelings, and nationality. Start by teaching basic vocabulary words and phrases (you'll need to...
Curated OER
Running On Empty
Students research causes of rising gasoline prices. They collect data on fluctuating gasoline prices and analyze the data using Excel. They write comparative essays supporting their results and create PowerPoint presentations to present...
Curated OER
How Wet Did It Get?
Students measure the rainfall/snowfall on the playground on a rainy/snowy day with a rain/snow gauge. They draw a bar graph representing the amount of water that fell and observe a satellite image of the clouds and local weather system...
Curated OER
Tech Smart
Sixth graders practice computer skills. In this technology lesson, 6th graders use programs such as Microsoft Word, Excel, Print Shop, and PowerPoint. They use the Internet for research and data collection to be incorporated in their...
Curated OER
Rusted Roots
Students create a flowchart on the root cause method. In this inquiry lesson, students compare RCA and the DMAIC model with the scientific method of problem solving. They investigate a problem in school and present their findings in class.
Curated OER
How Did the First Asteroid Come to be Discovered?
Learners examine asteroids including how and when they were discovered. In this asteroid lesson plan students view a PowerPoint presentation on asteroids.
Teach Engineering
Load It Up!
See how a marshmallow can hold up a bridge load. Teams take a closer look at the design of bridge piers. They determine the types of loads that might affect a bridge, and, using that information, they calculate the needed cross-sectional...
Kenan Fellows
The Newton Challenge
Make Newton proud. Scholars apply their understanding of forces and energy to an engineering design challenge. They learn about simple machines, create a presentation on Newton's laws, and develop a balloon-powered car.
Curated OER
Fleece, Feathers, and Fur
Pupils improve vocabulary and explore predicting and categorizing after reading the book, Is Your Mama a Llama?
Curated OER
Graphing Ordered Pairs
Seventh graders investigate the concept of ordered pairs as found in Algebra. They are introduced to the data set that corresponds to the coordinate system. Also students practice the graphing the ordered pairs using the x and y axis.
Curated OER
Squares to Compare
Students investigate how to draw and classify two and three dimensional figures (squares, triangles, rectangles.)
Curated OER
Travel Time
Students use a migration map to estimate the distance traveled by a bird while migrating south. After calculating accurate estimates of the distance traveled, students compare the distances traveled with the amount of time elapsed.
Curated OER
Urban Changes
Students explore how landscapes undergo constant changes with urban development. They plan and build their own "city" by including features that have minimal resource demands to sustain the city itself.
Curated OER
Playground Zoom
Students observe and draw small objects on the playground or in the classroom with and without a magnifying glass. They explore how lenses can affect the way that an object is observed from afar or remotely sensed. Afterwards, they share...
Curated OER
Business Ownership
Students should identify and define the three basic forms of private business ownership.
Curated OER
Cost and Revenues
Students develop the key concepts of total, variable, fixed, average and marginal costs. The theory of using different business scenarios is applied to different situations for an extension to real life application.
Curated OER
Sliding into Equations
Ninth graders translate sentences into equations. They translate equations into sentences. They solve real life problems using verbal models to write equations. They create a problem solution graphic organizer in their journals.
Curated OER
Relationships in Geometry
Learners show the correlation between quadrilaterals, parallelograms, rectangles and squares.
Other popular searches
- Powerpoint Math Lessons
- Free Powerpoint Math Lessons
- Powerpoint Math Lessons 8.2d
- Powerpoint Math Lessons 82d


