Curated OER
Unit 6b -Year 5
If you have some 9-10 year olds who are ready for some 5th year math, then check out this UK math unit. There are 172 slides that cover all of the basic multiplication tables, relate those to division, fractions, sequencing, and an...
Curated OER
Visualizing and Naming Polygons
A really useful resource contains 116 slides covering basic geometric concepts related to 2-D or plane shapes. Shape properties, translations, reflections, congruence, symmetry, and grid work are all laid out in a comprehensive and...
Curated OER
da Vinci: Body Proportion Theories
Middle schoolers investigate the validity of da Vinci's proportion theory by recording human measurements on scatter plots. In groups of three, they record each other's height and wingspan to create a Powerpoint presentation, chart, or...
Curated OER
Creating Graphs
This graphing PowerPoint demonstrates how to use graphs to gather information. The slides contain examples of graphs and display the data clearly. This presentation also gives clear directions on how to construct various graphs by using...
Curated OER
Fast Talker - Ch 2 project
Tongue Twisters?! Create scatter plot graphs based on timing fellow classmates saying tongue twisters. Then investigate, display, and analyze the relationships based on functions. Wrap up this activity by making a poster or other...
Kenan Fellows
Math Made Simple as 1-2-3: Simplified Educational Approach to Algebra
Writing an equation of a line is as easy as m and b. A lesson plan presentation gives individuals different strategies for writing equations of lines. Some items provide a slope and a point while others provide two points. Whatever the...
Curated OER
Interpreting Line Graphs
Fifth graders interpret line graphs. In this graphing lesson, 5th graders first begin by reviewing the difference in bar and line graphs and what they are used for. Students practice interpreting the data on various line graphs and using...
Curated OER
Graphing at all Levels: It's a Beautiful Thing!
Mixing math and art is done in this lesson by applying graphing knowledge to create a unique piece of art. This lesson varies acording to the graphing knowledge of the artist. First, learners identify and review various types of graphing...
Curated OER
Counting Coins
Second graders identify a quarter, dime, penny, nickel, and dime. They match the coin with it's monetary value, collect data on excel spreadsheet, and create a graph in Excel. Students participate in group activities.
Curated OER
Math is Everywhere!
In this everyday math skills pretest, students answer ten multiple choice questions based on their knowledge of everyday math skills such as estimation, addition, and measurement.
Curated OER
Making Circle Graphs
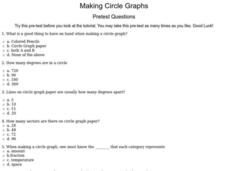
In this circle graphing worksheet, 6th graders answer ten multiple choice questions based on their knowledge of circle graphs. This is an interactive worksheet.
Curated OER
Special Ed. Resource
Ways to organize data is the focus of this math PowerPoint. Students view slides that define and give descriptions of a variety of graphs, and how mean, median, and mode are found. A good visual tool which should benefit almost all types...
Curated OER
Using Data to Make Graphs: Pretest
For this data worksheet, 5th graders answer multiple choice questions on data and graphs. Students answer 10 multiple choice questions.
Curated OER
Let's Graph It! Pre-Test
In this graphing worksheet, students complete a set of 10 multiple choice questions, clicking on a link to see correct answers or print the page.
Curated OER
Graph Made Easy: Post Test
In this graphs worksheet, students answer multiple choice questions about line graphs and bar graphs. Students answer 10 questions total.
Curated OER
Graphing Points: Post Test
In this graphing points instructional activity, students answer multiple choice questions about the points on a given graph. Students answer 10 questions total.
Curated OER
Making Circle Graphs
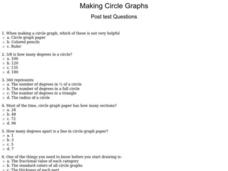
In this circle graphs worksheet, students answer multiple choice questions about how to make circle graphs. Students answer 10 questions total.
Curated OER
Year 5 - Term 2
This incredibly thorough and challenging presentation should engage all of your young math whizzes. Each of the 94 slides has tips, problems, puzzles, and brain teasers that will test the math abilities of even your top learners. An...
Curated OER
Read and Write Numbers up to 100,000
Use this lengthy, and challenging, presentation in your lesson on numeracy. Pupils practice their skills in reading and writing numbers up to 100,000, interpret a variety of graphs, solve word problems, and get to use a calculator. A...
Curated OER
Year 5, Term 2, Unit 9 - Day 1
A well-designed presentation can help your class with a variety of mathematical concepts. Pupils practice many different computational skills, such as addition, subtraction, finding multiples of 10, working with decimals, and solving...
Curated OER
Solving Systems by Graphing
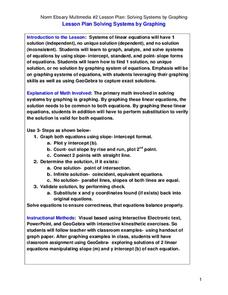
Students solve systems of equation through graphing. In this algebra lesson, students solve linear equations and analyze the result to figure out if there is one solution, no solution or infinitely many solutions. They graph their lines...
Curated OER
Using Excel To Teach Probability And Graphing
Students engage in the use of technology to investigate the mathematical concepts of probability and graphing. They use the skills of predicting an outcome to come up with reasonable possibilities. Students also practice using a...
Curated OER
Using Excel to Reference and Graph Live Data from a Web Site
Students collect live buoy data about water temperatures in the Gulf of Mexico from the Internet and work individually to organize their data and create a line graph using Excel Spreadsheet. Students analyze their data and examine any...
Curated OER
Graphing Points: Pre Test
In this graphing points worksheet, students complete multiple choice questions about axis's on a graph and points on a graph. Students complete 10 questions total.


