Curated OER
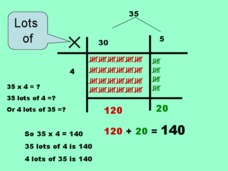
Grid: Multiplication and Tally Marks
I wouldn't say that making and counting tally marks is the best way to solve a multiplication problems, but this PowerPoint may prove me wrong. Kids solve double-digit multiplication problems using a simplistic grid and tally marks. They...
Curated OER
Graph Related Linear Inequalities
Learners explore the concept of linear inequalities. In this linear inequality lesson, students graph linear inequalities using Microsoft Excel.
Curated OER
Calculus 10.2 day 2 - Vector Valued Functions
Looking for a lesson on vectors? Here is a PowerPoint that has six examples for finding velocity, acceleration, speed and direction of motion. One of the examples demonstrates the use of the TI-89 Graphing Calculator to solve a problem.
Curated OER
Area and Perimeter
Another good presentation by Christine Berg is here for you. In it, learners are coached on definitions of area and perimeter and are shown how to perform calculations for both. They also see how to calculate the area of a triangle by...
Mathematics Assessment Project
Representing Functions of Everyday Situations
Functions help make the world make more sense. Individuals model real-world situations with functions. They match a variety of contexts to different function types to finish a helpful resource.
Primary Resources
Coordinate Pairs: An Introduction
Ordered pairs, the x and y-axis - sounds like it's time to introduce learners to the plotting points on a graph! This presentation is great as it introduces the concept, provides an example of how to use a coordinate plane, and then...
NOAA
Tracking a Drifter
Be shore to use this drifter resource. The third installment of a five-part series has learners using the NOAA's Adopt-a-Drifter website to track to movement of a drifter (buoy) in the ocean. Graphing the collected data on a map allows...
Curated OER
Graphing Ordered Pairs
Seventh graders investigate the concept of ordered pairs as found in Algebra. They are introduced to the data set that corresponds to the coordinate system. Also students practice the graphing the ordered pairs using the x and y axis.
Curated OER
Let's Graph It
In this let's graph it worksheet, student interactively answer 10 multiple choice questions about graphing data and types of graphs, then click to check their answers.
Curated OER
Math is Everywhere! Post Test
In this math test worksheet, students complete 10 multiple choice questions covering a wide variety of math concepts. An answer link is included.
Curated OER
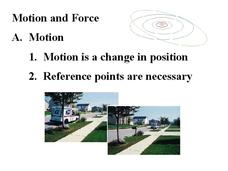
Motion and Force
All the main concepts in motion and force are covered in this presentation. Each slide is a great summary and will appeal to your students with a clean design and images that should seem relevant. Definitions of speed, displacement,...
Curated OER
Multiplying With Nine As A Factor
Elementary math minds complete various activities to memorize the multiples of nine. They watch a PowerPoint presentation and demonstrate the finger trick. Unfortunately the link to the multiplication activities does not take you...
Curated OER
Time/Elapsed Time
Young mathematicians complete various activities to demonstrate proficiency in telling time and identifying elapsed time. They analyze and discuss television schedules, create a booklet about their daily activities, produce a TV. guide,...
Alabama Learning Exchange
The World of Integers
Review operations related to rational numbers and integers using the include PowerPoint presentation, "Interesting Integers." Young mathematicians classify rational numbers as being natural, whole, or integers and read an article about...
Curated OER
Water Fun
Students examine uses for water. In this water lesson plan, students discuss how they use water. As a class students make a PowerPoint by naming one swimming safety rule. Students compare and contrast fishing for fun and fishing for...
Curated OER
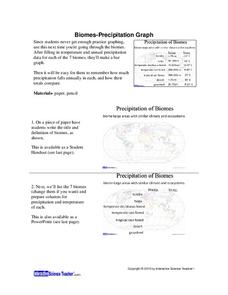
Biomes: Precipitation Graph
Students practice graphing by studying biomes. In this precipitation lesson, students graph the precipitation patterns for the 7 biomes on Earth. Students view a PowerPoint presentation in class which explores the 7 biomes and the...
Curated OER
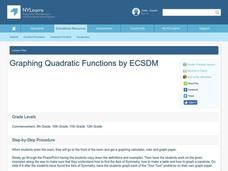
Graphing Quadratic Functions
Students graph quadratic functions. In this algebra lesson, students identify the vertex and intercepts of a quadratic equations and graph the parabola. They find the axis of symmetry and make a table to find the values of the parabola.
Curated OER
Using Data To Make Graphs
In this using data to make graphs worksheet, students interactively answer 10 multiple choice questions then click to check their answers.
Curated OER
Solving Inequalities and Graphing
Students solve and graph inequalities on a number line. In this algebra lesson, students solve using addition, subtraction, multiplication and division and graph their solutions using open or closed circles. They graph with 80%-90%...
Curated OER
Coin Tossing and Graphing
Fifth graders use technology as assistance to collecting random data. Through the random data they will be able to explain the significance of getting a head or tail depending on what was previously landed on. They will then analyze the...
Curated OER
Functions and Their Graphs.
Students solve equations and label it as a function or not. In this algebra lesson, students make a table of values and graph their equation. They identify the domain and range of each graph.
Curated OER
It's In The Chocolate Chips
Students investigate which brand of chocolate chip cookies contains the most chocolate. They analyze and compare data using Microsoft Word and Microsoft Excel. They communicate the results with Microsoft PowerPoint.
Curated OER
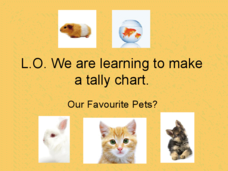
Pet Tally
Give the class an opportunity to practice using tally marks as a way to collect data. As you progress through the slide show, learners tally up the number and types of pets they see, they then use their data to create a tally chart....
Curated OER
Timetable Problems
Learning how to read a schedule and determine when you will depart and arrive is an everyday skill that builds competency in chart reading, subtraction, elapsed time, and counting on. Learners discuss how to solve timetable problems and...


