Curated OER
Graphing Equations
Students use an interactive website or cd rom to graph equations. The lesson plan is not very clearly written. The use of the website is essential or the educational software that can be purchased from the Prentice Hall publisher.
Curated OER
Pick a Pet
Students construct a pictograph of favorite pets. In this pets and graphing lesson, students discuss their favorite pet and use animal magazines to find their favorite pets and cut them out. Students create a pictograph using the pictures.
Alabama Learning Exchange
Writing Equations for Parallel Lines
Acquaint your class with the concept of parallel lines. Learners watch a PowerPoint presentation about how to write equations of parallel lines. Their understanding of linear equations and slope is taken a step further by the exercises...
Curated OER
Remembering Our Veterans
Eighth graders research a variety of military statistics while using the theme of Remebering Our Veterans. They use data management to plan and create a PowerPoint presentation with their findings. They incorporate different types of...
Curated OER
Linear Equations
In this algebra worksheet, students solve linear equations using one and two steps. They solve systems of equations using substitution and elimination with graphing. There are links for ready made tests and quizzes.
Curated OER
Teaching Polygons using Technology
Third graders utilize different types of computer programs, such as Microsoft paint and Microsoft Word to study and create different types of polygons. They use PowerPoint to create a story about a shape and others that it meets during a...
Curated OER
Osprey Journey
Students investigate the migration route of one bird, Osprey B4, using information gathered from satellites to track birds over a two-year period. They coimpare their graphs with maps of B4's migrations that have been plotted by...
Curated OER
Order of Operations
Sixth graders participate in an introductory lesson on the order of operations. For this order of operations lesson, 6th graders watch a video clip and a SMART Notebook or PowerPoint presentation of the concept. They apply a pneumonic...
Curated OER
Polluting the Environment
Fourth graders construct mini-ecosystem, pollute the ecosystem, observe, collect, and record data on the effects of these pollutants on their ecosystem, organize data on spreadsheets, create graphs, and design presentations to share with...
Curated OER
Anything I Can Do You Can Do Better
Students complete a two-week unit involving design and construction concepts. They watch a PowerPoint presentation about geometric shapes, draw the fourteen shapes incorporated in bridge construction, and in small groups design, build,...
Curated OER
Human Fingerprints: No Two the Same
Sixth graders explore scientific observations by analyzing a group of data. In this fingerprint identification lesson, 6th graders identify the reasoning behind fingerprinting and create their own ink fingerprints. Students discuss the...
Curated OER
The Good, The Bad, The Ugly
Sixth graders examine the causes of the stock market crash of 1929. In this integrated math/history unit on the stock market, 6th graders study, research, and read stocks, visit a local bank, and create a PowerPoint to show the finished...
Curated OER
Moon Craters Lab
Students explore characteristics of mass. In this scientific inquiry about mass lesson, students drop rocks of different weights from various heights and record the depth of the "crater" created. Students record their findings on a data...
Curated OER
Coordinates
These simple slides demonstrate how to use ordered pairs. They explain how a coordinate plane is set up, then show a series of images located on the grid. The class decides which ordered pair is missing from each object, then determine...
Curated OER
Linear Inequalities
Ninth graders graph linear inequalities. For this Algebra I lesson, 9th graders examine the graph of a linear inequality and in a game format, test coordinates to determine the region of the graph that satisfies the inequality.
Curated OER
Equations, Expressions, Factorization
Students graph and solve equations and expressions. In this algebra lesson, students use simple factorization to simplify expressions. They review for an exam by doing basic algebra.
Science Matters
Richter Scale
The 12th lesson in a series of 20 opens with a demonstration of exponential functions using pasta. This concept is connected to the Richter Scale, which is also an exponential function. Scholars compare the exponential scale that...
Curated OER
Let's Line Them Up!
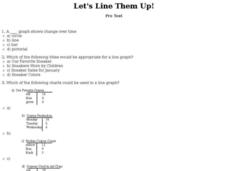
In this line graph worksheet, students read through the problems about graphing and line graphs. Students select the best answer to solve the 10 online questions.
Curated OER
Lesson 5: The Quadratic Formula
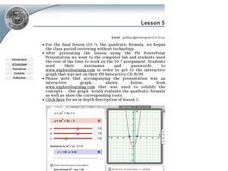
Students plot quadratic curves to distinguish how different values of a affect a graph. They solve quadratic equations by completing the square. Student's recognize the connection between the roots and the corresponding graph's...
Curated OER
The Coordinate Plane
Students engage in a lesson that is about the concept of graphing using the coordinate plane. They view a PowerPoint presentation and practice solving different problems. Students discuss vocabulary words with the help of the PowerPoint.
Curated OER
Integers
Students graph integers on a number line. For this integers lesson, students create a colored foldable to assist them with notetaking and problem solving. Students complete exercises from text.
Curated OER
Pictures of Data
In this data worksheet, students look at maps and charts and answer multiple choice questions about them. Students complete 10 questions.
Curated OER
Solutions to Equations with Variables on Both Sides
Learners solve equations with variables on both sides. In this algebra lesson, students solve equations using addition, subtraction, multiplication and division. They graph their solution on a coordinate plane.
Curated OER
Lesson 3: The Quadratic Equation
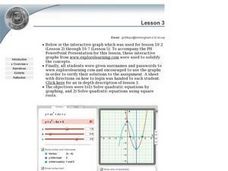
Young scholars explore quadratic equations. They use interactive graphs (on the Internet) to verify and solve solutions. Students solve quadratic equations by using square roots. Young scholars examine examples of inequalities.


