Curated OER
Solving Systems of Linear Equations Graphically
Learners solve systems of equations graphically. In this algebra lesson, students find the point of intersection of two lines if they are not parallel. They rewrite the equation in the y=mx + b form and graph using slope and intercept.
Curated OER
Guess the Age
Students describe graphically, algebraically and verbally real-world phenomena as functions; identify the independent and the dependent variable. They translate among graphic, algebraic, and verbal representations of relations and graph...
Curated OER
Guess the Age
Learners explore functions using real world application. In this algebra lesson, students play a game as they apply concepts of function. They graph their findings and discuss it with the class.
Curated OER
How Wet Did It Get?
Students measure the rainfall/snowfall on the playground on a rainy/snowy day with a rain/snow gauge. They draw a bar graph representing the amount of water that fell and observe a satellite image of the clouds and local weather system...
Curated OER
Matrix Operations
Students solve problems using matrices. In this algebra lesson, students add, subtract and multiply matrices. They use the graphing calculator to simplify and graph linear equations.
Curated OER
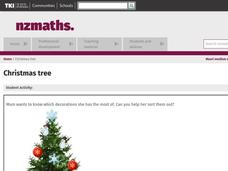
Christmas Tree
Ask the students for ideas on sorting the decorations so that they could tell someone what was in the box. Students share idea for sorting a box of Christmas decorations so that they could tell someone what was in the box. They share...
Curated OER
Fraction Clue Box
Students distinguish between proper and improper fractions. They create a "Character Clue Box" that represents a fraction. Fractions are picked from a hat and then groups go outside and search for items that represent their fraction....
Curated OER
Body Language
First graders investigate the three main parts of a plant. In this plant parts lesson, 1st graders explore vocabulary for the topic and read a story about plant parts. Students view a PowerPoint and take a quiz for the topic. Students...
Curated OER
A Lottery of Learning
Students investigate the probability necessary to win the lottery. They view a PowerPoint Presentation, evaluate combinations, calculate lottery probability, conduct analysis of a fair game, and design a lottery to meet various...
Curated OER
Tracking Your Favorite Web Sites
Ninth graders track the hit count on their favorite web sites. In this Algebra I lesson, 9th graders record the number of hits on their favorite web site for twenty days. Students explore the data to determine if the relation defines a...
Curated OER
Where a Shape Will be After Two Translations
Show your class some ways to calculate shape translation. They can consider seven shapes on a coordinate grid. Then, they must turn the shapes on the grid given a set of directions on the slides. I would use this for practice or review.
PBS
Accessible Shapes
All the 2-D and 3-D measurement work you need is in one location. Divided into three sections, the geometry lesson plans consist of visualization of three dimensions, classifying geometric figures, and finding surface area and volume....
Federal Reserve Bank
Lesson 4: Back to School
Based on your current level of human capital, how long would it take you to earn $1,000,000? What about your potential human capital? Learners explore the importance of education and experience when entering the workforce, and compare...
Curated OER
Matrix Operations
Two real-world activities to practice adding, subtracting and multiplying matrices to problem solve. Data from several Pro football quarterbacks is used in one activity to make some predictions based on their stats. Then the class takes...
Curated OER
Beary O'Mometer Learns About Careers In Meteorology
Students explore the field of meteorology. In this meteorology lesson, students explore weather-related careers as they research the field of study as well as various weather concepts. Students interview meteorologists, write business...
Curated OER
Human Fingerprints: No Two The Same
Students will be offered numerous opportunities to further enhance their observational skills as well as the integration of math with their continual exposure to the metric system, measurement, and graphing to represent their data....
Curated OER
Measures of Central Tendency
Learners analyze data using central tendencies. In this statistics lesson, students collect and analyze data using the mean, median and mode. They create a power point representing the different measures of central tendency.
Curated OER
How Do You Get to School?
Third graders talk about all the various ways they get to school. They make a list of all the bus numbers that the students use. They also list all the other methods of transportation used and solidify a hypothesis.
Curated OER
Order of Operations
Sixth graders are introduced to the concept of the orders of operations. The skills of using exponents are needed before trying the new concept. Students can be separated in groups for scaffolding.
Curated OER
Probability and Applications of Simulations
Middle schoolers apply properties of probability to the real world. In this probability instructional activity, learners simulate the construction of empirical distribution. They collect and analyze data using central tendencies.
Discovery Education
Sonar & Echolocation
A well-designed, comprehensive, and attractive slide show supports direct instruction on how sonar and echolocation work. Contained within the slides are links to interactive websites and instructions for using apps on a mobile device to...
Curated OER
Learning and Population Information - Where I Live
Students study their county populations in a multimedia presentation format. In this populations lesson, students work in groups of 3 to research the county populations in their state. Students chart their results in an Excel document...
Curated OER
Phenomenal Weather-Related Statistics
Eighth graders research, collect and interpret data about weather statistics. They record that data on spreadsheets. they create Powerpoint presentations on their individual or group research.
Curated OER
PASS the Arts
Students explore math and art concepts, create digital art examples of the concepts, and incorporate these works into a PowerPoint portfolio with explanation and analysis.


