CCSS Math Activities
Smarter Balanced Sample Items: High School Math – Target M
Your knowledge of graphs is a function of how much you try. Young mathematicians work on a set of 12 questions that covers graphing functions, comparing functions, and rewriting functions in different forms to determine key features....
Curated OER
Narnia Bar Charts
Here is a fabulous presentation that combines math and literature. Learners construct bar charts and frequency charts about things that happen in Narnia. Student pairs are assigned tasks regarding the variety of characters found in the...
CCSS Math Activities
Smarter Balanced Sample Items: High School Math – Target J
Good graphs make solving systems simpler. Pupils answer 18 questions shown in a PowerPoint presentation as part of the Claim 1 Item Slide Show series. By considering these questions, they review the concepts of graphing equations and...
BW Walch
Creating and Graphing Exponential Equations
Frequently found in biology and economic application problems, exponential equations show up as stars in this introductory presentation. Taking no background or knowledge of exponentials for granted, the slides walk learners...
Curated OER
Identifying Different Types of Graphs
This is an outstanding presentation on graphs and statistics. Learners choose which type of graph is being shown, and also gain practice in the techniques used to find the mean, median, and mode of sets of numbers. Very good!
Curated OER
Reading Bar Charts
Help kids understand how to collect data through surveys, organize data in a bar chart, then analyze their findings. There are three different surveys for learners to conduct, a full description of all the parts of a bar chart, and three...
CCSS Math Activities
Smarter Balanced Sample Items: High School Math – Target C
Let units pave the way to success. A set of five questions in a helpful PowerPoint presentation highlights the SBAC Claim 1 Target C high school item specifications. It covers the use of units to steer solutions, identifying appropriate...
CCSS Math Activities
Smarter Balanced Sample Items: High School Math – Target L
Functions are for forming context models. A PowerPoint file contains 11 questions for learners to answer. It covers the high school SBAC Claim 1 Target L item specifications and requires interpreting functions, determining appropriate...
CCSS Math Activities
Smarter Balanced Sample Items: 8th Grade Math – Claim 3
Communication is the key. A dozen sample items require scholars to communicate their reasoning involved in arriving at a solution. The PowerPoint from the Gr. 8 Claim 2 - 4 Item Slide Shows series uses a variety of content to...
BW Walch
Solving Linear Inequalities in Two Variables
Although graphing a linear inequality on the plane is but a few steps added onto the graphing of a linear equation, for many learners the logical leap is quite intimidating. This approachable PowerPoint presentation breaks graphing...
Curated OER
How to Draw a Bar Chart Correctly
Your class has gathered their data, so what's the next step? They need to display and analyze their data, and a bar chart is a perfect tool for the job. This resource provides the step-by-step instructions those kids need to construct a...
Curated OER
Creating Tables and Bar Charts
A great way to introduce the concepts of data collection, bar charts, and data analysis. Learners see how their teacher used the data from fifty of her friends to construct a bar chart showing their favorite toys.
Curated OER
Bar Chart Questions
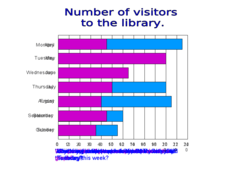
This resource includes two useful slides. Slide 1 is a bar chart that shows the number of people who went to the library in a weeks time, for discussion. Slide 2 includes a similar chart along side 10 data analysis questions for learners...
Curated OER
Position and Time Graphs
A series of graphs are displayed with points plotted for time and position. A question is asked for each, requiring your class to view one axis and track its partner coordinate. A few examples are given to begin each section, and so this...
University of North Texas
Library of Functions
Join the family picnic and see how all the functions come together in a PowerPoint that highlights their main features. As it includes topics such as domain, range, and intercepts, the slides are a great guide to promote class...
Curated OER
Unit 6b -Year 5
If you have some 9-10 year olds who are ready for some 5th year math, then check out this UK math unit. There are 172 slides that cover all of the basic multiplication tables, relate those to division, fractions, sequencing, and an...
Curated OER
Visualizing and Naming Polygons
A really useful resource contains 116 slides covering basic geometric concepts related to 2-D or plane shapes. Shape properties, translations, reflections, congruence, symmetry, and grid work are all laid out in a comprehensive and...
Curated OER
Creating Graphs
This graphing PowerPoint demonstrates how to use graphs to gather information. The slides contain examples of graphs and display the data clearly. This presentation also gives clear directions on how to construct various graphs by using...
Curated OER
Fast Talker - Ch 2 project
Tongue Twisters?! Create scatter plot graphs based on timing fellow classmates saying tongue twisters. Then investigate, display, and analyze the relationships based on functions. Wrap up this activity by making a...
Curated OER
Special Ed. Resource
Ways to organize data is the focus of this math PowerPoint. Students view slides that define and give descriptions of a variety of graphs, and how mean, median, and mode are found. A good visual tool which should benefit almost all types...
Curated OER
Year 5 - Term 2
This incredibly thorough and challenging presentation should engage all of your young math whizzes. Each of the 94 slides has tips, problems, puzzles, and brain teasers that will test the math abilities of even your top learners. An...
Curated OER
Read and Write Numbers up to 100,000
Use this lengthy, and challenging, presentation in your lesson on numeracy. Pupils practice their skills in reading and writing numbers up to 100,000, interpret a variety of graphs, solve word problems, and get to use a calculator. A...
Curated OER
Year 5, Term 2, Unit 9 - Day 1
A well-designed presentation can help your class with a variety of mathematical concepts. Pupils practice many different computational skills, such as addition, subtraction, finding multiples of 10, working with decimals, and solving...
Curated OER
Grid: Multiplication and Tally Marks
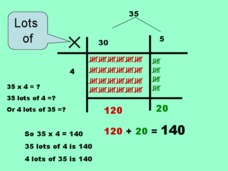
I wouldn't say that making and counting tally marks is the best way to solve a multiplication problems, but this PowerPoint may prove me wrong. Kids solve double-digit multiplication problems using a simplistic grid and tally marks. They...


