Curated OER
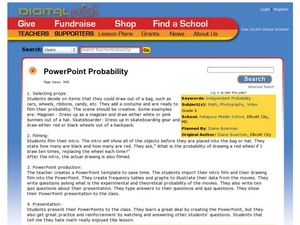
PowerPoint Probability
Sixth graders investigate film making by creating a video about probability. In this math visualization lesson, 6th graders create a presentation for their class demonstrating the probability of random events taking place in the real...
Curated OER
Shapes
Students identify attributes of different geometric shapes. In this geometry lesson, students view a PowerPoint presentation on shapes and use attribute blocks to examine the corners and edges of each shape. Students work together to...
Kenan Fellows
Using Water Chemistry as an Indicator of Stream Health
Will this water source support life? Small groups test the chemistry of the water drawn from two different sources. They then compare the collected data to acceptable levels to draw conclusions about the health of the source. The...
Curated OER
Similar Triangles
Tenth graders practice solving proportions from similar triangles. They watch a PowerPoint presentation and complete a worksheet each of two days of this lesson. Links for worksheets and PowerPoint presentations are included with this...
Curated OER
Area and Circumference of Circles
Learners view two PowerPoints and practice computing the area and circumference of circles. They must use given formulas to make their computations. The lesson plan includes links to both PowerPoints as well as a worksheet (with answer...
Curated OER
Area and Circumference of Circles
Learners calculate the area and circumference of a circle as the lesson plan is presented through an animated Microsoft PowerPoint presentation. They then complete a project to review the previous day's material.
Curated OER
Write an Equation of a Line Given Slope and a Point
Ninth graders are investigating slope of a line. The line is plotted using the slope and points on a line. They also write an equation given the right information. The use of a PowerPoint is part of the presentation.
Curated OER
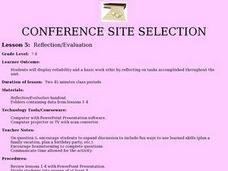
Reflection/Evaluation
Learners practice the skills of reflection and evaluation. In this reflection lesson, students are grouped together and asked to brainstorm what they have learned during a particular unit. Learners decide what they want to share with the...
Curated OER
The Nitty-Gritty of Checkbooks
Students explore how to maintain a checking account. They control, disburse money, and keep their checking account balance. Through a PowerPoint demonstration, video streaming and hands-on practice, students apply the information given...
Curated OER
Experimental Probability
While just a simple lesson, this activity on experimental probability could provide a way to connect this concept to real life. Learners begin by participating in a probability activity using a coin, and then move on to create their own...
Curated OER
Inventions
Students study invention steps and design their own invention. In this invention lesson, students discuss inventions and the process of inventing. Studnets write in an inventor's journal and study various types of inventions. Students...
Visa
Making Decisions
What economic factors can influence personal and financial decisions? In an effort to understand opportunity costs and the time value of money, pupils engage in role-playing activities and discussion, as well as view a PowerPoint...
Curated OER
The Nifty Fifty-What's Your Size?
Learners explore state populations. In this state geography lesson, students use a variety of technology tools to research and graph population and area of assigned states.
Curated OER
Symmetry of Road Signs
Students identify symmetry in road signs. In this geometry instructional activity, students explore objects in the real world for symmetry. They perform translation, rotation and reflection.
Curated OER
Probability and Applications of Simulations
Middle schoolers apply properties of probability to the real world. In this probability lesson plan, learners simulate the construction of empirical distribution. They collect and analyze data using central tendencies.
Curated OER
Student Exploration: Fraction, Decimal, Percent
Students explore the concept of fractions, decimals, and percents. In this number sense lesson, students use a worksheet to guide them through the exploration of the relationship between fractions, decimals, and percents. Students work...
Curated OER
Direct, Inverse, And Joint Variation
Students engage in a lesson that has them practice solving equations using multiplication and division. They practice solving problems using the properties needed and then students practice changing word problems into an equation.
Curated OER
Inductive and Deductive Reasoning
High schoolers use logical arguments and inductive reasoning to make or disprove conjectures. After observing a teacher led demonstration, students discover that the deductive process narrows facts to a few possible conclusions. In...
Curated OER
Leaf Peeping at Sharpe!
While this lesson focuses on observations made at Sharpe Reservation, another area could be used. Learners map out a route from their class to a nature preserve. Then, they identify the color and features of the leaves, and describe...
Curated OER
Data Analysis Digital Display
Students create a survey online. In this math lesson, students graph survey data using flisti.com. They share and analyze their classmates' histogram.
Teach Engineering
Exploring Energy: What Is Energy?
...Then the water heater exploded like a bomb. Using a video of an exploding water heater, the resource presents the definitions of energy, potential energy, and kinetic energy to be used in later lessons of the unit.
Curated OER
Measures of Central Tendency
Young scholars analyze data using central tendencies. For this statistics lesson, students collect and analyze data using the mean, median and mode. They create a power point representing the different measures of central tendency.
Curated OER
Teaching Polygons using Technology
Third graders utilize different types of computer programs, such as Microsoft paint and Microsoft Word to study and create different types of polygons. They use PowerPoint to create a story about a shape and others that it meets during a...
Curated OER
Slope
Students calculate the slope of a line. In this slope lesson, students use a graph, an equation or two points to help them calculate the slope of a line. They differentiate between a slope of zero and an undefined slope.
Other popular searches
- Free Powerpoint Math Lessons
- Powerpoint Math Lessons 8.2d
- Powerpoint Lessons for Math
- Math Powerpoint Lessons
- Powerpoint Math Lessons 82d


