Mathematics Assessment Project
Interpreting Distance–Time Graphs
Pre-algebra protégés critique a graph depicting Tom's trip to the bus stop. They work together to match descriptive cards to distance-time graph cards and data table cards, all of which are provided for you so you can make copies for...
National Security Agency
Multiple Representations of Limits
After an introductory activity to demonstrate the theory of a limit, additional activities approach a limit from graphical, numerical, and algebraic methods. The activity looks at the multiple ways of understanding and evaluating a limit.
Curated OER
Graphs and Data
Students investigate poverty using graphs. In this algebra lesson plan, students collect data on the effects of poverty and use different rules to analyze the data. They graph and use the trapezoid rule to interpret the data.
Curated OER
Jumping to Solutions
Students explore two-step linear equations. In this middle school Pre-algebra instructional activity, students create and solve equations that describe how a person got to an end postion on a ruler by jumping. After physically creating...
Curated OER
Solving Fractions with Manipulatives
Students use candy bars, beef jerky, and brownies to represent different fractions. Students also use colored multi-link cubes or blocks to illustrate the same representations of fractions. Students work with a partner to create diagrams...
Alabama Learning Exchange
Add, Subtract, and Multiply Matrices
Introduce the concept of matrices with a pre-designed instructional activity. Learners watch video lessons to learn the ins and outs of adding, subtracting, and multiplying matrices. Using provided problems, they practice each operation...
Curated OER
Equations Lesson 1
Middle schoolers engage in a study of equations and how they are solved using algebraic methods. This overrides the fact of guessing as done in earlier grades. They cover the concept of inverse operations as the main way to manipulate...
Curated OER
Squares in the Light
Students collect and analyze data using a graph. In this algebra instructional activity, students explain their findings orally and with a graph. They use their knowledge to solve real life scenarios.
Curated OER
Fractal Fern
Students identify the location of coordinate pairs of an image. In this geometry lesson, students perform transformation and identify the image and pre-image point of location. They apply the concept of fractals to complete the...
Curated OER
Interpreting Graphs
Sixth graders interpret linear and nonlinear graphs. They create graphs based on a problem set. Next, they represent quantitive relationships on a graph and write a story related to graphing.
Curated OER
What's My Rule? Simple Linear Functions
Students investigate simple linear functions by trying to guess a function rule from inputs and outputs. They write the function rule in algebraic form.
Curated OER
Fashion Sense and Dollar Wise
Students work in groups to show understanding of the relationship between fractions, decimals, percentages, and the application of ratios and proportions. In this decimals, fractions, and percents lesson plan, students use real life...
Curated OER
Percents: What's the Use?
Students explore percentages in real world situations. In this percents lesson, students determine the final sales price after discounts. Students interview community members and determine how percentages are used in the real world.
Curated OER
Percents: What's the Use
Students research percentages in real world situations. In this percents lesson, students demonstrate their ability to apply percents to everyday situations. Students communicate mathematically by conducting interviews about percents and...
Curated OER
Fashion Sense and Dollar Wise
Young scholars find the cost of an outfit. In this percentages lesson plan, students look at ads, pick out an outfit, and find the sale price. They create a commercial and complete 4 included worksheets.
Curated OER
Linear Equations
Ninth graders solve linear equations. For this Algebra I lesson, 9th graders investigate the properties of equations (Reflexive, Symmetric, Transitive, Substitution, and Transformation Properties) and use these properties to solve...
Curated OER
Exploring Renewable Energy Through Graphs and Statistics
Ninth graders identify different sources of renewable and nonrenewable energy. In this math lesson, learners calculate their own carbon footprint based on the carbon dioxide they create daily. They use statistics to analyze data on power...
Curated OER
Discovering Pi
Define terminology related to a circle. Practice accuracy in measuring and then create a spreadsheet based on data collected from solving for parts of a circle. Groups can have fun analyzing their data as it relates to Pi.
Curated OER
Equations Lesson Plan
Seventh graders play "What's my Rule" beginning with simple equations and working towards harder problems as student's gain confidence. They evaluate the equations by graphing them. Students identify the slope and y intercepts of the...
Curated OER
Cook Me Up Some Equations
Young scholars study a variety of math concepts in the context of cooking up a meal. In this math lesson, students calculate surface area and volume. They draw and interpret different types of graphs.
Curated OER
Multiplying and Dividing Integers/Relay Race
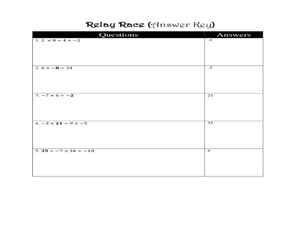
Give your class a list of multiplication and division sentences that contain both positive and negative integers. Have them analyze them to see if they can discover the pattern with the signs. From these patterns, help them develop the...
Curated OER
Graphing Linear Equations Using Data Tables
Learners review the Cartesian plane and the process of plotting points. In groups, students create tables, identify the slope and y-intercept, and graph the equation. Afterward, learners perform the same process, only, individually. As a...
Curated OER
Linear Equations Data Tables
Students graph linear equations on a Cartesian plane. After describing data tables and their use, students explore how the information from a table can be used to create a line graph. They discuss reasons for plotting a minimum of...
Curated OER
Bridge Design and Bridge Building
Seventh graders conduct an investigation into the design of bridges and their construction. Students design bridges and draw detailed plans. For assessment they construct a model of a bridge that is made entirely of toothpicks. Students...


