EngageNY
More on Modeling Relationships with a Line
How do you create a residual plot? Work as a class and in small groups through the activity in order to learn how to build a residual plot. The activity builds upon previous learning on calculating residuals and serves as a precursor to...
Curated OER
Pizza! Pizza!
Third graders tally, sort, and organize pizza orders from monthly school sales. They create an advertising campaign to promote the School Pizza Sale, record the data in graph form, compare and contrast the tallies throughout the year,...
Kent State University
How Does that Work?
Sixth and seventh graders explore algebra word problems. They work with a partner to solve word problems distributed by e-mail. Learners simplify mathematical expressions following a "think aloud" algebra strategy modeled by the teacher....
EngageNY
Analyzing Residuals (Part 1)
Just how far off is the least squares line? Using a graphing calculator, individuals or pairs create residual plots in order to determine how well a best fit line models data. Three examples walk through the calculator procedure of...
Curated OER
Even/Odds Game
Using a game format, learners review what they know about theoretical probability. As they roll tetrahedron dice, they record their results as odd or even. Afterwards, they discuss their findings.
Google
The Law of Large Numbers and Probability
Learners investigate why theoretical probability doesn't always match reality. The activity involves using Python 2.7 (or Sage) to set up a Bernoulli Trial. It also involves setting up a spreadsheet to simulate the Birthday Paradox....
American Statistical Association
How Random Is the iPod’s Shuffle?
Shuffle the resource into your instructional activity repertoire. Scholars use randomly-generated iPod Shuffle playlists to develop ideas about randomness. They use a new set of playlists to confirm their ideas, and then decide whether...
EngageNY
Designing a Search Robot to Find a Beacon
Build right angles using coordinate geometry! Pupils explore the concept of slope related to perpendicular lines by examining 90-degree rotations of right triangles. Learners determine the slope of the hypotenuse becomes the opposite...
EngageNY
Matrix Notation Encompasses New Transformations!
Class members make a real connection to matrices in the 25th part of a series of 32 by looking at the identity matrix and making the connection to the multiplicative identity in the real numbers. Pupils explore different matrices and...
Curated OER
NIGHT AND DAY: DAILY CYCLES IN SOLAR RADIATION
High schoolers examine how Earth's rotation causes daily cycles in solar energy using a microset of satellite data to investigate the Earth's daily radiation budget and locating map locations using latitude and longitude coordinates.
Utah Education Network (UEN)
The Human Line Plot
Learners collect data and use charts and line plots to graph the data. Some excellent worksheets and activities are embedded in this fine lesson plan on line plots.
Curated OER
Rubber Band Banza
Third graders review ideas about sound and vibration to make their own stringed instrument. They review what a pictograph and bar graph are. Pupils conduct a survey within the classroom to choose the four favorite string instruments and...
Curated OER
Let's Plot Points
Use coordinate grid paper to plot points and identify shapes that are already plotted on the paper by saying their coordinates. Pupils also measure the distance between points and play the game Battleship. There are several web links and...
Curated OER
Stone Soup
Students examine the topics of conflict, resolution, and solution using the book "Stone Soup." They create a class pictograph using real vegetables brought in by the students, answer story comprehension questions, and sequence the events...
Curated OER
Walk-A-Thon
Students graph linear http://www.lessonplanet.com/review?id=180542equations. In this problem solving lesson, students calculate slope and plot ordered pairs on a coordinate grid. Using a real-life example of a walk-a-thon, students...
Wisconsin Online Resource Center
Oversized Inch
Each member of the class creates their own paper ruler. Using their ruler, kids walk around the room measuring the objects you've specified. Discuss how items should be measured to the 16th of an inch, the smallest unit on their ruler....
Ohio Literacy Resource Center
Converting Units of Measure
Follow six steps to implement this series of metric worksheets. Here, mathematicians exhibit their knowledge of problem solving, while converting units of measurement and label their answers with the applicable unit name.
Curated OER
The Hat
Honing reading and communication skills through the theme of farm animals is the focus of this lesson. Students read a book about Scandinavian farm animals and complete prediction journal activities. They complete a worksheet about the...
Curated OER
Maximize It!
Students design a rectangular box without a lid that has the largest possible volume using the supplied sheet of centimeter graph paper. They work in groups to construct different size boxes to determine the largest possible volume and...
Curated OER
Cover and Boarders
Students find the area and perimeter of rectangular figures. They use this information to find patterns and discover relationships between area and perimeter. Students apply and explain formulas relating to perimeter, area, and volume.
Curated OER
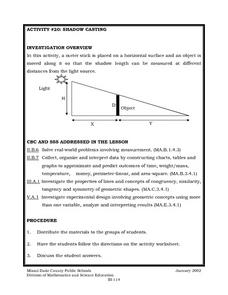
Shadow Casting
Eighth graders use a meter stick that is placed on a horizontal surface and an object is moved along it so that the shadow length can be measured at different distances from the light source. They solve real-world problems involving...
Curated OER
Career Connections: The Connection Corner
Students will create a career information center. In this careers lesson, students research careers on a local and national level and create a help wanted ad for an occupation of personal interest. Students create a brochure and...
NASA
Solar System Scale & Size
Use a variety of whole fruits to represent the different planets in the solar system to introduce scale sizes to your math or space science class. They follow suit by creating a non-scaled model of the solar system using specific-colored...
Curated OER
Lines of Best Fit
Students explore the concept of line of best fit. In this line of best fit instructional activity, students find lines of best fit in examples about riding your bike home from school and dentistry. Students find two data points and find...


