Energy for Keeps
Renewable Energy Action Project: What's in Your Energy Portfolio?
Uncover the renewable energy potential in your region. The activity outlines an approach to research current practices and trends. Learners conduct surveys to assess the attitudes of the local population and prepare a paper summarizing...
Curated OER
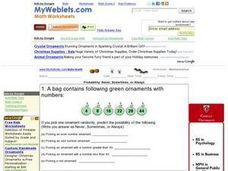
Ornaments Probability
In this probability worksheet, students analyze 6 ornaments with different numbers. Students answer 6 questions in which the probability (never, sometimes or always) is determined.
Curated OER
Probability
Students investigate probability. For this fourth through sixth grade mathematics lesson, students collect, organize and display data in an appropriate chart or graph as they calculate and apply basic probability.
Curated OER
Types of Graphs
Fifth graders construct graphs. In this graphing lesson plan, 5th graders learn about various types of graphs such as bar, line, circle, picture and stem and leaf plot. Students work in groups to create examples of each graph.
Curated OER
What Are My Chances?
Students calculate probability. In this lesson on probability, students use given data to calculate to chances of a given event occurring. Many of the calculations in this lesson are applicable to daily life.
Curated OER
The Fair Factor
Students participate in playing many games to determine if they are fair or not. They create their own game that is fair to play with their classmates.
Curated OER
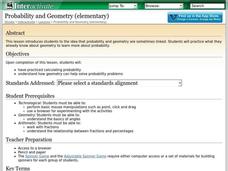
Probability and Geometry
Young scholars examine the relationship between probability and geometry to solve problems. In this geometry and probability lesson plan, students investigate the effect of changing percentages on a spinner to the probability of landing...
Curated OER
Probability Popsicle Pop-ups
Fourth graders decorate and use popsicle sticks as manipulatives to assist with their learning of probability. They utilize a worksheet imbedded in this plan to organize the results of their experiment. They make a stem and leaf plot...
Curated OER
Backyard Critters
Young scholars explore the characteristics of invertebrates in their backyards. They observe, describe, and classify specimens. They conclude with a "snail race."
Curated OER
Probability Using M&M's
Students estimate and then count the number of each color of M&M's in their bag. In this mathematics lesson, students find the experimental probability of selecting each color from the bag. Students create pictographs and bar graphs...
Curated OER
Red Walls and Green Doors
Fourth graders are shown a pattern and asked how many blocks it would take to have a red wall with fifty green doors. In groups, they are given a set of manipulatives in which they develop the pattern and share their results with the...
Curated OER
Data Analysis and Probability Race to the Finish
Students practice addition facts, record data, and construct a bar graph. In this probability lesson, students participate in a board game in which bicycles move towards a finish line based on players completing addition problems. Dice...
Curated OER
What Are The Odds?
Students read the book, Jim Ugly, and discuss whether the odds were in favor of or against the character Jake finding his dad. They demonstrate an experiment involving odds by keeping a tally of how many times a colored die is pulled out...
Curated OER
Probability
Second graders experiment with probability. In this probability lesson plan, 2nd graders pick colored beans from a bag to find the chance of getting different colors. They make fair and unfair spinners and record the data after spinning...
Curated OER
Tall Tale Rollers
Students explore American tall tales. In this tall tale lesson, students discover the six characteristics that are included in tall tales. Students survey their class to find each student's favorite tall tale character and organize the...
Curated OER
Not Everything is More Expensive
Students compare prices and determine percent increases and decreases of items in order to make wise purchases. In this percent increases and decreases lesson plan, students calculate the amounts based on grocery store ads.
Curated OER
Changes in Force, Motion, and Energy
Eighth graders construct various machines and compare the work done by them.
Curated OER
Geo Jammin' By DeSign - Day 1, Lesson 4: Transformation Station
Second graders manipulate triangles to discover the concepts of slides, flips and turns of a geometric shape.
Curated OER
Kindergarten Exploration Tubs
Students identify their names as a symbol for themselves. They describe characteristics of organisms. They utilize tools to gather data and compare size.
Curated OER
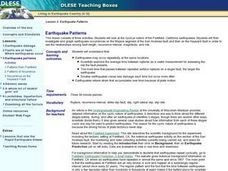
Earthquake Patterns
Students identify and interpret the cyclical nature of the Parkfield, California earthquakes. They then investigate and graph earthquake occurrences on the Mojave segment of the San Andreas fault and then on the Hayward fault in order to...
Curated OER
The Old Lady and Probability
First graders explore the concept of probability using a familiar nursery rhyme. Over the course of several lessons, they determine the probabilty of events happening in the nursery rhyme, "There Was An Old Lady." Students graph and...
Curated OER
Strike a Pose: Modeling in the Real World (There's Nothing to It!)
Adjust this lesson to fit either beginning or more advanced learners. Build a scatter plot, determine appropriate model (linear, quadratic, exponential), and then extend to evaluate the model with residuals. This problem uses real-world...
Curated OER
Teaching Polygons using Technology
Third graders utilize different types of computer programs, such as Microsoft paint and Microsoft Word to study and create different types of polygons. They use PowerPoint to create a story about a shape and others that it meets during a...
Curated OER
Build a Skittles Graph
Students construct a bar graph with a given set of data. They calculate the ratio and percent of the data. Students discuss alternate ways of graphing the data as well as multiple strategies to approach the task.


