Curated OER
Shop 'Til You Drop
Students compare food prices to find the lowest unit price and make choices about where to shop and what to purchase on weekly items, cost comparisons and items needed. They collect grocery ads and weekly sale flyer's to expedite their...
Curated OER
Buying on Credit
Students determine how buying on credit adds to the total cost of an item by computing the interest. They find a major item advertised in a magazine and identify the price. Then they identify the rate of a credit card and calculate the...
Curated OER
Lemonade for Sale
Third graders engage in a read-aloud of the book, "Lemonade for Sale." They collect data from the story and turn the data into a mathematical graph. This lesson has a rubric for you and the students to follow-very creative lesson.
Curated OER
High Mountain Retreat
Learners explore and analyze atmospheric conditions for a high mountain retreat. They examine the relationship between altitude, atmospheric pressure, temperature and humidity at a particular location. In addition, they write reports...
NASA
Solar Systems: Sequences and Probabilities
In this sequences and probability activity, students solve 3 problems by writing out all the possibilities for the solution and they use probability to find their answers. They determine the probability of solar flares happening on a...
Curated OER
Which Car Should I Buy?
Students use gas mileage of different cars to create T charts, algebraic equations, and graphs to show which gets better mileage. In this gas mileage lesson plan, students use the graph to see which car they should buy.
Curated OER
How Fast Is Fast?
Students make sensible estimates and check the reasonableness of the answers. Students write and solve problems involving decimal multiplication and division. Students perform calculations with time.
Curated OER
Weather Dot Com
Students examine the need for a standard unit of temperature and measure temperature with a thermometer. They discuss the details of a thermometer and the calibrations used, record temperature data for inside and outside, explore...
Curated OER
Triangles
Fourth graders participate in three experiments to gain understanding of triangles. In this triangles lesson, 4th graders use pipe cleaners to create bubble pipes, basketball hoops and bingo cards to display the characteristics of...
Curated OER
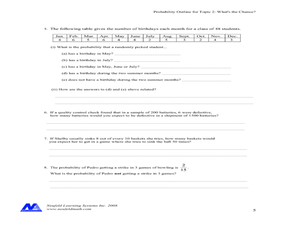
Concept: What's The Chance?
In this concept worksheet, students perform probability experiments. Using collected information, they interpret the data. Students answer questions about probability. This five-page worksheet contains approximately 15 multi-step...
Curated OER
Holy Mole
Students discover Mexican culture by reading and cooking. In this Central American History lesson, students read the book Holy Mole, and analyze the story by answering questions about plot, characters and even sound effects they would...
Curated OER
Graphing and Analyzing Biome Data
Students explore biome data. In this world geography and weather data analysis lesson, students record data about weather conditions in North Carolina, Las Vegas, and Brazil. Students convert Fahrenheit degrees to Celsius degrees and use...
Curated OER
Build A Skittles Graph
Students explore graphing. In this graphing lesson, students sort Skittles candies and use the color groups to create a bar graph. Rubrics and extension activities are provided.
Curated OER
Global Statistics
Students determine statistics based on data. In this statistics lesson, students use data and record in charts. Students create graphs based on the statistics found.
Curated OER
Let's Go Shopping: Estimation At The Mall
Students estimate the total cost of a shopping trip. In this estimation lesson, students use three different techniques to estimate how much a shopping trip will cost.
Curated OER
Probability With a Random Drawing
Students define probability, and predict, record, and discuss outcomes from a random drawing, then identify most likely and least likely outcomes. They conduct a random drawing, record the data on a data chart, analyze the data, and...
Curated OER
Study of Chance
Seventh graders determine the fairness of various games. In this determining the fairness of various games lesson, 7th graders use spinners, dice, and rock,paper, scissors to play various chance games. Students determine if each game...
Curated OER
Monohybrid Crosses
Students define the terms monohybrid cross and Punnett Square. As a class, they discuss the Law of Segregation and probability to complete a practice problem. To end the lesson plan, they predict the probability of certain types of...
Curated OER
All About Shoes
Students sort shoes. In this sorting lesson plan, students use shoes to explore attributes and practice sorting. This lesson plan encourages the use of a Venn Diagram to aide in student sorting.
Curated OER
How Much Is Too Much?
Learners examine population growth and collect data. In this statistics lesson, students create a scatter plot to represent the different species found in the water and are being harvested. They graph their data and draw conclusion from it.
Curated OER
Fun With Sound
Second graders make predictions. In this sound lesson, 2nd graders listen to various sounds, and write down and draw what they think that sound is. Students make a chart of their predictions.
Curated OER
Pumped Up Gas Prices
Learners investigate the concepts of differing gas prices and how they are set in different geographical areas. They conduct research about the economic concepts of supply and demand and predict the outcomes upon the prices of gasoline.
Curated OER
Probability
In this problem solving instructional activity, students determine which spinner will most frequently land on a color choice of a color wheel. In this coloring and multiple choice instructional activity, students will answer two questions.


