Albert Shanker Institute
Economic Causes of the March on Washington
Money can't buy happiness, but it can put food on the table and pay the bills. The first of a five-lesson unit teaches pupils about the unemployment rate in 1963 and its relationship with the March on Washington. They learn how to create...
Curated OER
Ohio Census 1990 & 2000
Students use Ohio census data to solve problems, make comparisons, draw conclusions, and support predictions related to Ohio's population. They interpret and work with pictures, numbers and symbolic information.
Curated OER
Track's Slippery Slope
Students graph data of sports figure running time using x-axis y-axis to find slope of trend line, mathematically find the interpolated and extrapolated values for data points. Using the information they make predictions.
Richland County School District One
Falling Into Geometry Through Paper Art
New-to-school learners create a fall quilt consisting of three different paper geometric quilt squares. They use various geometric shapes that when assembled will form a scarecrow, pumpkin, and a crow. Assembly will require sorting...
Curated OER
Walking the Plank
This is a cool math activity. Kids collect and interpret data based on a physical act. A board is balanced between a scale and a step, learners record a peer's weight as it decreases while s/he walks further away from the scale. They...
Curated OER
Prescient Grading
Do homework grades really determine test scores? Learn whether lines of best fit, correlation coefficients, and residuals can be used to determine test scores when given homework grades. (It would certainly save teachers time in grading...
Serendip
Understanding and Predicting Changes in Population Size – Exponential and Logistic Population Growth Models vs. Complex Reality
Salmonella poisoning impacts over 200,000 people in the United States each year. Scholars learn about the growth of these bacteria using multiple approaches. Then they apply the same growth calculations to endangered species and think...
Virginia Department of Education
Growing Patterns and Sequences
Learners explore, discover, compare, and contrast arithmetic and geometric sequences in this collaborative, hands-on activity. They build and analyze growing patterns to distinguish which kind of sequence is represented by a set of data...
Curated OER
Counting, Properties of Numbers, and Reasoning about Numbers
Five days of lessons develop number sense and counting patterns, including odd and even numbers, 5s and 10s, doubles, and ways to make 10. Each session opens with fun finger play to reinforce counting and reasoning about numbers. Various...
Concord Consortium
Gestation and Longevity
Is the gestation length of an animal a predictor of the average life expectancy of that animal? Learners analyze similar data for more than 50 different animals. They choose a data display and draw conclusions from their graphs.
Curated OER
How Much is it Worth?
Money makes everything a little more fun for your mathematicians! Show them how they can implement their addition skills in the real world using this instructional activity. Scholars examine six sets of coins, which are photographed....
EngageNY
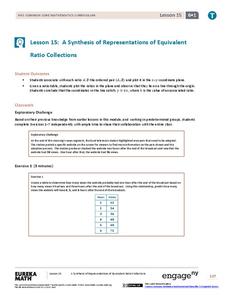
A Synthesis of Representations of Equivalent Ratio Collections
Make all the ratio representations fit together. The 15th segment in a series of 29 presents ratio problems to solve. Scholars use a variety of representations to respond to the questions. The problem set has pupils show how the...
Big Kid Science
Measuring Shadows Using an Ancient Method
How did ancient peoples determine the height of really tall objects? Young scientists and mathematicians explore the concept of using shadows to measure height in a hands-on experiment. Paired pupils measure shadows, then calculate the...
Achieve
Ground Beef
Ever wonder how a butcher creates the different types of ground beef? Young mathematicians explore the methods butchers use to create their desired ground beef quality. Given a combination of two types of meat with varying...
Willow Tree
Approximating a Line of Best Fit
You may be able to see patterns visually, but mathematics quantifies them. Here learners find correlation in scatterplots and write equations to represent that relationship. They fit a line to the data, find two points on the line, and...
American Statistical Association
Spinners at the School Carnival (Unequal Sections)
Everyone's a winner. Scholars analyze a spinner with five unequal sections, three of which represent winning a toy car and the other two represent winning a toy truck. They conduct an experiment to estimate the number of toy cars and...
Mathed Up!
Stratified Sampling
Young mathematicians learn how to solve problems involving stratified sampling. They review concepts of sampling and proportionality by watching a video and then they complete a learning exercise of questions on this topic.
K20 LEARN
You’re The Network: Data Analysis
How do you rate? Young scholars use graphical data to analyze ratings of different television episodes. Their analyses include best-fit lines, mean, median, mode, and range.
Radford University
Danger! – An Analysis of the Death Toll of Natural Disasters
Decipher the danger of natural disasters. Using researched data, scholars work in groups to create data displays on the number of deaths from different types of natural disasters. They share their graphical representations with the class...
Radford University
How Normal Are You?
It's completely normal to learn about normal distributions. An engaging lesson has young statisticians collect and analyze data about their classmates as well as players on the school's football team. They determine whether each set of...
Radford University
Pizza, Pizza!
Ponder the problem of pizza prices. Pupils use provided information about two different pricing schedules for pizza. They create tables of values and functions to represent the pricing schemes, consider domain restrictions, and identify...
Radford University
Geyser Graphical Activity
Thar she blows! An engaging activity teaches pupils about geysers. They first read information about the Strokkur geyser in Iceland and analyze data on its eruptions by creating multiple data representations. Once finished, they research...
Curated OER
Everyday Measurements
Fourth graders practice measuring items with unconventional methods. In this measurement prediction activity, 4th graders estimate the length of items a teacher brings to class and record their predictions. Students measure...
Curated OER
Here Comes the Sun
Third graders watch a video on the solar system and examine the role of the sun. As a class, they complete a KWL chart and make different color temperature pockets to use during their experiment. In groups, they make predictions about...


