101 Questions
Toothpicks
Analyze patterns and build functions. Young scholars work on their modeling skills with an inquiry-based lesson. After watching a video presentation of the problem, they write functions and make predictions.
EngageNY
Calculating Conditional Probabilities and Evaluating Independence Using Two-Way Tables (part 2)
Without data, all you are is another person with an opinion. Show learners the power of statistics and probability in making conclusions and predictions. Using two-way frequency tables, learners determine independence by analyzing...
EngageNY
Normal Distributions (part 2)
From z-scores to probability. Learners put together the concepts from the previous lessons to determine the probability of a given range of outcomes. They make predictions and interpret them in the context of the problem.
Sea World
Splash of Math
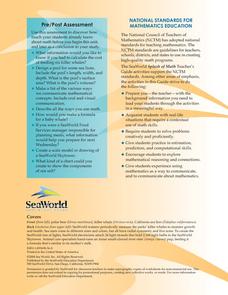
How can kids use math to learn about marine life? Combine math skills with science lessons in a resource featuring activities about life in the sea. Kids graph and calculate data, solve complex word problems, measure geometric shapes,...
Curated OER
Applied Science - Science and Math Lab
Students make a prediction. In this applied science instructional activity, students guess the number of items in a jar. Students create a bar graph to show the predictions and the actual amounts.
EngageNY
Interpreting Residuals from a Line
What does an animal's gestation period have to do with its longevity? Use residuals to determine the prediction errors based upon a least-square regression line. This second lesson on residuals shows how to use residuals to create a...
EngageNY
Informally Fitting a Line
Discover how trend lines can be useful in understanding relationships between variables with a lesson that covers how to informally fit a trend line to model a relationship given in a scatter plot. Scholars use the trend line to make...
American Statistical Association
Scatter It! (Predict Billy’s Height)
How do doctors predict a child's future height? Scholars use one case study to determine the height of a child two years into the future. They graph the given data, determine the line of best fit, and use that to estimate the height in...
Charleston School District
The Line of Best Fit
If it's warm, they will come! Learners find a line of best fit to show a relationship between temperature and beach visitors. Previous lessons in the series showed pupils how to create and find associations in scatter plots. Now,...
Curated OER
Meteorological Predictions
Pupils make a link between prediction and hypothesis in math and science. Based on data collected over one week, students evaluate the predictions of local weather forecasters, compare the predicted outcomes to the actual weather...
Curated OER
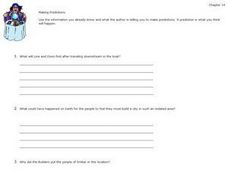
Making Predictions
Students explore the concept of probabiility and outcome through several decision making activities. Making accurate predictions in daily life including weather forecasting, stock market selections, or job changes are all dependent on...
Curated OER
Problem-Solving Application: Making Predictions
In this problem-solving worksheet, students learn how to make a prediction in problem-solving by using the 4 steps: understand, plan, solve and look back. They then use this problem-solving skill to answer 4 questions.
Radford University
Tuition Cost Activity
Can I afford to go to college? Small groups design a method to research college tuition for several years and make a prediction of costs in 2025. Classmates plot the the data on a scatter plot and graph the line of best fit to make their...
Radford University
Basketball Math
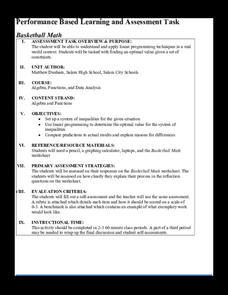
Shoot for a better knowledge of optimization strategies. During the first part of the task, scholars use given basketball shooting percentages for different players to predict the winner by examining systems of inequalities. For the...
Curated OER
Toothpick Patterns
In this patterning worksheet, students identify and complete 15 different patterns that include using toothpicks. First, they determine the number of toothpicks needed to create each figure in a given sequence. Then, students determine...
Virginia Department of Education
Linear Curve of Best Fit
Is foot length to forearm length a linear association? The class collects data of fellow scholars' foot length and the length of their forearms. They plot the data and find a line of best fit. Using that line, they make predictions of...
MENSA Education & Research Foundation
Probably Probability
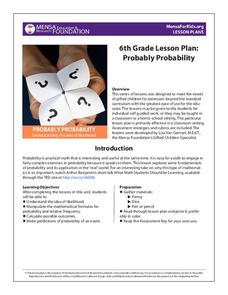
Reinforce the concept of probability with a series of lessons highlighting the idea of likelihood, probability formulas, relative frequency, outcomes, and event predictions. The collection is made up of four lessons offering informative...
Curated OER
Math in the Wetlands Field Trip
Get your class out in the environment for hands on math activities. For this wetlands lesson, learners transplant native plants, calculate how much soil is needed, and perform math activities based on this experience. They then make...
Houghton Mifflin Harcourt
Unit 8 Math Vocabulary Cards (Grade 4)
Enhance fourth graders' math vocabulary with 17 word cards and their definitions. Learners focus on terms that deal with graphing, such as y-axis, coordinates, plot, and ordered pair in the last set of math vocabulary cards.
Curated OER
Soaring Towers
How tall can your tower get? Implement shapes, building strategies, teamwork, and prediction in this interactive tower activity. Learners discuss past experiences with stacking materials, recalling ways they kept it from falling over....
Curated OER
Fast Talker - Ch 2 project
Tongue Twisters?! Create scatter plot graphs based on timing fellow classmates saying tongue twisters. Then investigate, display, and analyze the relationships based on functions. Wrap up this activity by making a...
Curated OER
When Will We Ever Use This? Predicting Using Graphs
Here are a set of graphing lessons that have a real-world business focus. Math skills include creating a scatter plot or line graph, fitting a line to a scatter plot, and making predictions. These lessons are aimed at an algebra 1...
American Statistical Association
Scatter It! (Using Census Results to Help Predict Melissa’s Height)
Pupils use the provided census data to guess the future height of a child. They organize and plot the data, solve for the line of best fit, and determine the likely height and range for a specific age.
PBL Pathways
Students and Teachers
Predict the future of education through a mathematical analysis. Using a project-based learning strategy, classes examine the pattern of student-to-teacher ratios over a period of years. Provided with the relevant data, learners create a...


