Curated OER
Bits and Pieces I
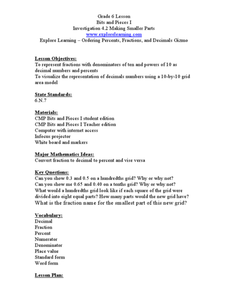
Sixth graders examine making smaller parts out of fractions and decimals. In this online interactive fractions, decimals, and percents activity, 6th graders represent fractions with denominators of ten. Students then represent powers of...
Illustrative Mathematics
Extending the Definitions of Exponents, Variation 1
Scientist work with negative integer exponents all the time. Here, participants will learn how to relate negative exponents to time and to generate equivalent numerical expressions. Learners will apply the properties of integer exponents...
Curated OER
Grade 5: Alphabet Frequency
Fifth graders collect and organize data from writing samples, use fractions and decimals to describe the experimental data, and use the experimental results to make predictions about the frequency of letter usage in the English language.
Curated OER
High and Low Tides
Students collect real world data from the Web regarding high and low tides at various locations in the United States. They find a function which models this data and make predictions on tide levels based on the information found.
Curated OER
Treasure Hunt
Students find lost "treasure" using a treasure map after being shown a map that you have created where terms and symbols are discussed. The class is divided into small groups where they locate your treasure and then read a section from...
Pennsylvania Department of Education
Equally Likely and Unequally Likely Outcomes
Students explore probability. In this statistics/probability lesson, students compare experimental and theoretical probability and use experimental probability to make predictions and conjectures. Students explore the...
Curated OER
How Many in a Minute
Students estimate what they can accomplish in a minute. In this estimation lesson, students guess how many jumping jacks or stars they can draw in a minute. They get timed and see how close they are to their prediction.
Curated OER
Sink or Float
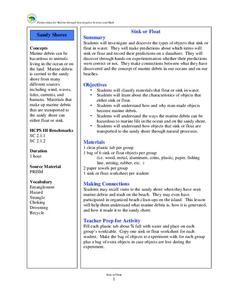
Students explore water properties by conducting a class experiment. In this buoyancy lesson, students make predictions as to whether or not specific objects will sink or float in water. Students conduct the experiment and record their...
Curated OER
Two Owl Eyes
First graders listen to the story, Olivia Counts, and demonstrate counting to ten. They make predictions, and recognize the day and night sky. They add page number 2 to their counting books.
Curated OER
What's Poppin'?
Second graders determine and compare weights and volumes of popped and unpopped corn to make predictions and solve problems. Students combine the data of each group into a graph. They construct questions, statements and story problems...
Curated OER
You Can Bank on It
Students analyze the impact of the J.P. Morgan/Chase Manhattan merger, and predict how the merger affect the company's financial performance. They create annual reports for the company based on their predictions.
Curated OER
Estimation Investigation
Students view an interactive video to explore the concepts of estimation. They work cooperatively to measure, make comparisons, make predictions, and verify results.
Curated OER
Precalculus: Function Models for Real-Life Situations
Learners use calculators and "by hand" techniques to compare models of real-life data situations, determine the best model for a situation, and use their models to make predictions.
Curated OER
Pop Clock
Students review the Census Bureau's Homepage, gather information regarding population trends in order to make predictions on future populations.
Curated OER
The Foot Book
Students use estimation and measurement skills to make predictions and solve problems about length. They also analyze data presented to calculate ratios and percents.
Curated OER
Population Demographics: Our Aging World
Students examine the impact of the aging population. In this demographic lesson, students evaluate, analyze, and make predictions about the aging world around them.
Curated OER
Tracking Your Favorite Web Sites
Ninth graders track the hit count on their favorite web sites. In this Algebra I instructional activity, 9th graders record the number of hits on their favorite web site for twenty days. Students explore the data to determine...
Curated OER
Don't Let Parabolas Throw You
Young scholars identify relation, function, patterns and range. In this algebra lesson plan, students factor and graph quadratic equations. They use transformation to move the parabola around and make predictions.
Curated OER
Candy is Dandy
Students view the benefits of using graphs to communicate information, answer questions and solve problems. They investigate color distribution in bags of M & M's. Working with actual bags of candy, they will sort and classify contents.
Curated OER
What Is It?
Students explore the likelihood of events. In this logical thinking lesson, 3rd graders are given several scenarios and determine whether the possibility of the described event actually happening is likely, unlikely, or...
Curated OER
The Birthday Problem
Students make and analyze predictions and attempt to solve the birthday problem. They use the solutions they find to answer related questions.
Curated OER
Thirst Dilemma (Drinking in the Desert)
Ninth graders explore linear functions. In this Algebra I instructional activity, 9th graders collect and analyze date as they investigate the question of how long will water last if you are trapped in a desert. ...
Curated OER
String Of Lights
Young scholars collect, graph and analyze data. In this statistics lesson, students compare data using different types of graphs. They make predictions, draw conjectures as they analyze bulbs used in a holiday light set.
Curated OER
Graphing Data Brings Understanding
Young scholars collect, graph and analyze data. In this statistics lesson, students use circle, pie, bar and lines to represent data. They analyze the data and make predictions bases on the scatter plots created.


