Curated OER
Engineering: Which Roof Is Tops?
Students determine regional climates by examining photos of house roofs. They observe teacher-constructed examples of roofs and make predictions as to which style is best for snowy climates. After evaluating the examples, they record...
Curated OER
Using Data Analysis to Review Linear Functions
Using either data provided or data that has been collected, young mathematicians graph linear functions to best fit their scatterplot. They also analyze their data and make predicitons based on the data. This lesson is intended as a...
Curated OER
Leeches: Who Knew?
The answer key to a page of questions about a children's reading on leeches, this resource is missing its companion text. However, the questions could be used with any age appropriate reading about leeches. Readers make predictions,...
Curated OER
Energy Choices
Students add and multiply decimals to complete gas choice worksheets. They discover which gas supplier has the best gas prices. Students collect and interpret data about local natural gas suppliers and use this information...
Curated OER
Snowboarding! Join the U.S. Team: Olympics, Math, Weather
Young scholars make weather predictions and observations, research the cost of snowboarding equipment, and use their math skills to plot the course of a Giant Slalom Snowboarding event.
Curated OER
Food Chains: Integrating Science and Reading
Using a high interest science topic, like the food chain, can get students excited about reading, math, and more! A multitue of wonderful ideas that have cross-curricular connections.
Curated OER
Seein' Double, Seein' Double
By using the Internet, hands-on activities, video, and cooperative learning, pupils look into the conditions in which light casts shadows on objects. The lesson plan includes fabulous hands-on activities, art projects, worksheets, and...
Core Knowledge Foundation
Columbus Sailed the Ocean Blue
Young adventurers embark on a journey, setting sail along the blue ocean with Christopher Columbus. Teachers will find that this unit makes their lesson planning smooth sailing!
Curated OER
Predicting Temperature: An Internet/Excel Learning Experience
Third graders use the Internet (www.weather.com) to find the high temperature for our locale and the high temperature for another city around the world. They keep track of the temperature in these two locations for 10 days.
Curated OER
Probability, Genetics and the Human Condition
Students explore the concept of probability as it relates us to be able to make predictions about future events based upon our knowledge of past outcomes. They have an innate appreciation for probability. Students make a connection...
Curated OER
Math: Football Fever Fun
Learners compile statistics from high school or other football team and construct a spreadsheet on which to record their findings. Using Chart Wizard to analyze the data, they construct charts and graphs for a visual display of the...
Curated OER
Can You Make a Hole in One?
Students relate miniature golf to reflection of an image. In this algebra lesson, students collect and graph data as they study linear equations. They apply properties of graphing to solve real life scenarios.
Curated OER
Math: Party Time!
Twelfth graders discover how to calculate the total costs for a party. They determine the unit prices of food and supplies, the quantities needed, and complete a chart displaying their findings. Students calculate the costs per serving...
Curated OER
Habitat Choice in Woodbugs
Students investigate woodbugs. For this scientific investigation lesson, students explore the steps scientists take when conducting an investigation using live specimens. Students explore habitat preferences for woodbugs in various...
Curated OER
The 400-Meters Race
Students collect and graph data. In this algebra lesson, students describe, interpret and analyze data. They follow a 400 meters race and plot the coordinates of the course. They graph a line to represent the data of the course.
Curated OER
Flip a Coin
Students are introduced to the concept of probability. In groups, they make a prediction about how many times a coin might show heads or tails when flipped. They carry out the experiment and record their results to compare it to their...
Curated OER
Statistics and Probility
Seventh graders collect data and make predictions. In this geometry lesson, 7th graders work in tiers collecting data and plotting it. They make inferences and predictions about their collected data.
Curated OER
Dating Practices
Students interpolate, extrapolate, and make predictions from given information. They present results and conclusions from given data using basic statistics. Pupils create a survey from a critical question and decide which sampling...
Curated OER
Technology Lesson Plan
Students measure various objects using non-standard units. The goal is for them to practice measuring in order to apply the physical act to various objects found in the classroom. The lesson is ideal for the kinesthetic learners and...
Curated OER
Probability
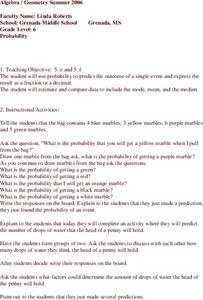
Sixth graders study the probability of single events. Given a bag of marbles, they discuss and find the probability of single events. In groups of two, 6th graders complete additional activities, predicting the probability. Students...
Curated OER
Statistics and Shopping
Students examine statistics and data analysis concepts from the practical questions that arise in everyday life.
Curated OER
High School Mathematics Problems from Alaska: Investigation of Herring Statistics
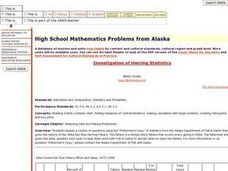
High schoolers read complex charts, find measures of central tendency, calculate large numbers, create histograms and box plots. They answer questions using the "Fisherman's Copy" of statistics.
Curated OER
Growing Up With A Mission
Student measure heights and graph them using growth charts for which they find the mean, mode, and median of the data set. They graph points on a Cartesian coordinate system.
Curated OER
Environmental Graphing
Learners experiment with graphing. In this graphing introduction lesson plan, students complete four activities: 1) a bar graph based on class birthdays 2) an estimation graph of the raisins in raisin bread 3) another estimation example...


