Curated OER
Childhood Obesity
Students identify a question to generate appropriate data and predict results. They distinguish between a total population and a sample and use a variety of methods to collect and record data. Students create classifications and ranges...
Curated OER
Repeating Patterns
Learners explore growth patterns by using manipulatives such as pattern blocks, investigate growth pattern of pattern, record growth in T-chart, describe how pattern is growing, and predict number of blocks needed to extend pattern.
Curated OER
Calculating Buttons
Students, after reading "The Button Box" by Margarette S. Reid, analyze real-world data by surveying a sample space. They predict the generalization onto a larger population utilizing calculators and computers. Students total categories,...
Curated OER
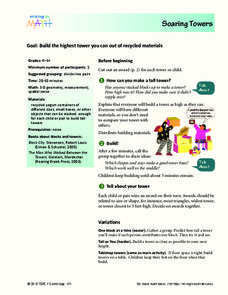
Soaring Towers
Students build towers from recycled materials. in this building lesson, students build the highest tower they can from varied materials. They focus on shapes and which items should go on the bottom to make a strong base.
Curated OER
To Be Linear or Not to be Linear, That is the Question
Students use their knowledge and understanding of equations of lines to explore independent and dependent variables. They determine how to isolate a variable and how to predict data points not represented in data.
Curated OER
Mary, Mary, Quite Contrary
First graders use simple vegetable cut out and colored paper flower peddles to make simple patterns. They start out with a simple 2-element patterns around the theme of a daisy and increase in difficulty.
Curated OER
Whirlybirds
Young scholars measure to the nearest centimeter, and predict the frequency of an event. In this statistics lesson, students participate in a simulation of a parachute jump competition by making paper Whirlybirds, and then dropping them...
Curated OER
Popcorn
Students discuss the properties of popcorn. They explore the connection between corn, popcorn and Thanksgiving. As a class, students sing a popcorn song and create a popcorn craft. They practice writing the word popcorn. As a...
Curated OER
Probability Distributions
Students collect and plot data on a graph. In this statistics lesson, students analyze the distribution of a sample and predict the outcome. They find the line of best fit and discuss what would make the sample larger.
Curated OER
Caps For Sale
Learners read the story Caps For Sale and read companion stories, predict in a chart, work with rhyming and word families, answer short answer questions, and more. In this reading lesson plan, students take 5 days to read the...
Curated OER
Number Patterns
Fourth graders recognize patterns in a series of numbers and symbols. They also make their own patterns and explain them in writing. After practicing with a worksheet imbedded in this plan, 4th graders attempt to make up their own number...
Curated OER
Finding the Shape of a Web
Students examine spider webs they find as they explore outside. They make T-chart of the shapes found in two different webs and draw them on geoboard paper. Next, they measure length and width of a spider's web before checking to see if...
PBS
The Housing Crisis: GDP, Housing Bubble, Recession
Secondary pupils examine the housing bubble and the 2008 and global economic crisis. Defining GDP and GDP growth, recession, and bubbles, young economists debate what makes a bubble and how housing can be an economic indicator....
Curated OER
Probability and Statistics: Post Test
In this probability and statistics worksheet, students complete a set of 10 multiple choice questions, clicking on an answer link to view correct answers.
Curated OER
Studying Special Segments in Triangles
Students investigate special segments in triangles. In this geometry lesson plan, students graph, compare, estimate and predict findings based on their data. They differentiate between similarity and congruence of triangles.
Curated OER
Eye Spy a Pattern
Fifth graders examine how to see patterns by showing how things work together. They identify, analyze and determine a rule for predicting and extending numberical patterns involving operations of whole numbers, decimals and fractions.
Curated OER
How Does Your Plant Grow?
Middle schoolers measure and record their height in centimeters on a graph. By integrating math and science, students collect data and apply graphing skills to the experiences they are having growing plants. Finally, middle schoolers...
Curated OER
Fold and Cut
Second graders explore line symmetry and the names and attributes of two-dimensional mathematical shapes. They study the context by folding and cutting out shapes to make a series of mathematical shapes.
Curated OER
Risky Business - Or Not!
Students explore the concept of the stock market. In this stock market lesson, students discuss the stock market and how it works. Students hypothesize what makes a stock price go up or down. Students watch a short video about the...
Curated OER
Probability
Learners explore the concept of probability. In this probability lesson plan, students draw golf balls of different colors out of a bag and determine the probability of drawing a particular colored ball. Learners make a number wheel with...
Curated OER
Advanced Sentence Completion: 11
In this sentence completion worksheet, middle schoolers fill in the blank for the correct words for each sentence. Students complete 10 multiple choice questions. Click on "show all" to see the rest of the worksheet.
Curated OER
A Birthday Basket for Tia
Students practice reading and math skills using technology. In this main idea lesson, students retell the important events of A Birthday for Tia in sequence using Kid Pix. Students create a bar graph using The Graph Club...
Curated OER
Investigation-How Far Can You Jump?
Pupils explore measurement. In this math lesson, students measure how far they can jump using blocks. Pupils compare the results when different sized blocks are used. Students estimate the distance jumped.
Curated OER
Smoking: The Real Cost
Third graders discuss the adverse effects of smoking and predict the financial cost of a smoking habit. They collect data regarding the cost of a pack of cigarettes and average packs smoked a day. They create bar graphs displaying the...


