EngageNY
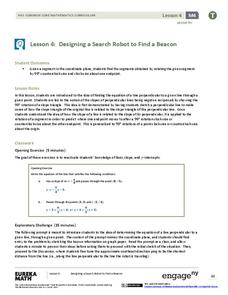
Designing a Search Robot to Find a Beacon
Build right angles using coordinate geometry! Pupils explore the concept of slope related to perpendicular lines by examining 90-degree rotations of right triangles. Learners determine the slope of the hypotenuse becomes the opposite...
Curated OER
Point Comparisons
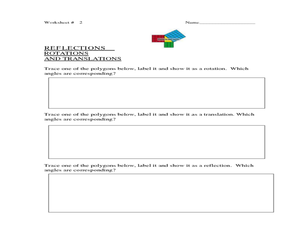
Young geometers investigate two-dimensional figures using coordinate grids. They identify polygons and draw examples of their reflection, rotation, and translation on a coordinate grid. And they complete a worksheet practicing examples...
PBS
Patterns to the Rescue!
Track down the Cyberchase episode that this lesson is associated with. Using a worksheet that is embedded in the plan, learners must find the next two numbers and shapes (a double pattern). Once these have been discovered, pupils try...
Curated OER
The Drum
Students complete a variety of activities related to the folktale from India, "The Drum." They listen to the story and answer comprehension questions, construct a coffee can drum, and complete a phonics and matching worksheet.
Curated OER
The Pythagorean Theorem and Classifying Triangles
Through the examination of the relationship between the lengths of the sides of a triangles high schoolers will learn the classification of triangles (acute, right, or obtuse).
Curated OER
Petro Products
In this petroleum products activity, students are given the components of crude oil and they graph the various products found in a 50 gallon barrel. Students complete an activity to determine if they have collected cards that represent...
Curated OER
Even/Odds Game
Using a game format, learners review what they know about theoretical probability. As they roll tetrahedron dice, they record their results as odd or even. Afterwards, they discuss their findings.
Curated OER
Basketball Bounces, Assessment Variation 2
This un-scaffold summative assessment tasks learners to use the height of a bouncing basketball, given the data in graph and table form, to choose the model that is represented. Learners then use the model to answer questions about...
Curated OER
Creating a Thematic Map
Students create and analyze a weather-related data table and a thematic map based upon information provided.
American Statistical Association
What is the Probability of “Pigging Out”
Learners apply their understanding of luck to a probability experiment. They play a game of Pass the Pigs to determine the probability of a specific outcome. Using analysis for their data, pupils declare the measures of center, dot...
Illustrative Mathematics
Kimi and Jordan
Kimi and Jordan have taken summer jobs to supplement their weekly allowances. Kimi earns more per hour than Jordan, but Jordan's weekly allowance is greater. This activity asks students to determine how the incomes of the two workers...
Statistics Education Web
The United States of Obesity
Mississippi has both the highest obesity and poverty rate in the US. Does the rest of the data show a correlation between the poverty and obesity rate in a state? Learners tackle this question as they practice their skills of regression....
5280 Math
Capture the Points
Play a game of capture the points. Young scholars receive a number line with specific points graphed and must write an inequality that captures all the points. The second task of the algebra project is to write an inequality with...
Mary Pope Osborne, Classroom Adventures Program
Mummies in the Morning Egyptian pyramids, hieroglyphics
Visit the Magic Treehouse and take your class on a trip through time with a reading of the children's book Mummies in the Morning. Using the story to spark an investigation into Egyptian culture, this literature unit engages...
Curated OER
Measurement: Measuring Hand and Feet
Here is a good lesson which invites learners to practice measurement using standard and nonstandard measuring tools. In this measurement lesson, learners work with length, width, height, and area. They use standard and nonstandard...
Curated OER
Seeing Is Believing
Students investigate the concepts of probability. They use data to find the central tendency, median, and mode. Students design and play a game in order to practice the concepts. They also complete a table with data that is analyzed.


