Curated OER
Mean Absolute Deviation in Dot Plots
The lesson focuses on the ideas of dot plot representations and the mean absolute deviation of data sets.
Curated OER
Leaf Weight-Loss Plan
Students measure the weight of a container of leaves daily to discover how quickly it grows lighter as the foliage dries.
Curated OER
Modern Physics, New Phenomena
For this physics worksheet, young scholars examine some of the historical theories of physics through the completion of 11 questions.
Curated OER
Off to College
High schoolers investigate linear, quadratic and exponential equations using the TI calculator. They identify relation and functions using ordered pairs, graph the data, analyze the data, and relate it to real-world situations.
Curated OER
High Exposure
Students interpret data they receive from the media, discuss possible misinterpretation of data from the media and correctly respond to the misconception quiz question.
Curated OER
The Fair Factor
Students participate in playing many games to determine if they are fair or not. They create their own game that is fair to play with their classmates.
Curated OER
Traveling Through the Solar System
Students use calculator and non-calculator methods for analyzing data. They apply data collection and analysis in a study of mass and weight. Students enhance and apply the concept of line of best fit. They master graphing in a plane,...
Curated OER
A Geological Puzzle
Students compare and contrast the various types of rocks on each continent. In groups, the calculate the rock ages and types to determine if the continents, in their opinion, were joined at one time. They develop two imaginary...
Curated OER
What Do We Do With A Dirty Bomb?
Students examine composition of dirty bomb and its possible effects on a city, and investigate simulations of such an event; students use computational and problem solving skills to assess damage and prepare report proposing solution to...
Curated OER
Structure and Function
Structure and Function
SynopsisStudents choose some biological object, examine its structure, and identify or speculate on one particular function. Next they create a blueprint of the object, focusing on the particular function. Then...
Curated OER
Jack and the Beanstalk Math
Students listen to Jack and the Beanstalk and determine what they think are the most common words. In this Jack and the Beanstalk lesson, students reread the story, count the words they chosen and graph those words. Students graph...
Curated OER
A Plane Old Time
Fourth graders become familiar with a chart and use the information to create a flight plan. In this flight plan lesson, 4th graders access background knowledge of the role of flight controllers and the number concepts they...
Curated OER
Box-and-Whisker Plots
Eighth graders measure in feet and inches and convert to explore the relationship between the converted measurements. In this measurement lesson, 8th graders use the whisker and box plot to represent the measurement of a cat. ...
Curated OER
Ocean Currents and Sea Surface Temperature
Students use satellite data to explore sea surface temperature. They explore the relationship between the rotation of the Earth, the path of ocean current and air pressure centers. After studying maps of sea surface temperature and ocean...
Curated OER
Significant What?
Students define accuracy and precision, and differentiate between the two terms, apply the concepts of accuracy and precision to a given situation and correctly apply the concept of significant figures to measurement and mathematical...
Curated OER
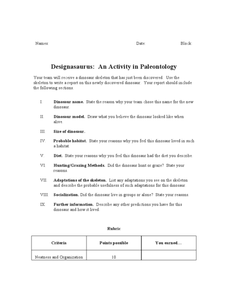
Designasaurus: An Activity in Paleontology
In this dinosaur instructional activity, students are given a dinosaur skeleton and they work in teams to report about a "newly discovered dinosaur". They create and include it's name, a model of it, its size, the habitat it lived in,...
Curated OER
Relative Ratios
Learners discover that proportions are made up of equal ratios each containing the same building blocks. They, using the Internet, apply their knowledge of direct relationships and proportions to problems in planetary science.
Curated OER
Boyle's Law Lab
In this gas lab, students use a pressurized soda bottle with a closed end syringe to simulate Boyle's Law. They alter the volume and watch the effects on the pressure of the gas. They plot their data and answer eight post lab questions.
Curated OER
Real Misleading Graphs
Students identify real graphs and misleading graphs. For this algebra lesson, students surf the Internet for real life scenarios where graphs are used in a misleading way as well as in a correct way.
Curated OER
Recognize, create and Record Simple Repeating Patterns
Students analyze, create, and record repeating patterns. In this geometry lesson, students create shapes using patterns and keep track of the different shapes. They incorporate transformation and reflections into their patterns.
Curated OER
The Numbers Tell the Story
Learners demonstrate how to gather and interpret statistical data. In this data analysis lesson, students search for statistics on the health effects of smoking and place the information into charts. Learners create these charts online...
Curated OER
Technology Blackout Day
Students describe the impact of modern technology inventions on daily life. They create a graph of the class's favorite item of technology and draw a picture of their favorite piece of modern technology.
Curated OER
Planning for and Surviving Earthquakes
Students work in small groups to explore the FEMA for Kids site. They take the role of FEMA officials. Student list three items they may need to survive an earthquake. They complete a worksheet and discuss their results with the rest of...
Curated OER
Transformation, Reflections, Rotations and Translations
Students create a quilt, using different patterns. For this geometry lesson, students apply prior knowledge as they use different patterns to help them create a quilt using transformations and geometric shapes.


