Beacon Learning Center
Beacon Learning Center: Leap Frog Experiment
Students design an experiment, collect information using tree diagrams, and interpret the results using charts in this interactive web lesson.
Microsoft
Microsoft Education Lesson Plan: Candy Is Dandy
Explore color distribution of M&M candies using this detailed lesson plan. An engaging integrated lesson that requires understanding of spreadsheets and formulas, and logical reasoning. Links to related websites.
Khan Academy
Khan Academy: Fitting Quadratic and Exponential Functions to Scatter Plots
Determine if a quadratic or exponential model fits a data set better, then use the model to make a prediction. Students receive immediate feedback and have the opportunity to try questions repeatedly, watch a video or receive hints.
Khan Academy
Khan Academy: Linear Regression Review
Linear regression is a process of drawing a line through data in a scatter plot. The line summarizes the data, which is useful when making predictions.
Science Education Resource Center at Carleton College
Serc: Yellowstone! A National Park on a Hot Spot
A lesson plan with an accompanying PowerPoint learning module for students where they learn about the volcanic features of Yellowstone National Park. They use spreadsheets to make various calculations, such as the volume of material...
Rice University
Rice University: The Hand Squeeze
Students will enjoy this data collection and class analysis experiment involving the time it takes for a hand squeeze to travel around a circle of people. From organizing the activity to collecting the data to making a table and graphing...
Other
Hsor.org: Modules: Targets the Markets
This module is intended for students in an Advanced Placement Statistics course or any high school course that addresses inferential statistics. In this module, students will explore the concepts of direct marketing, a marketing...
E-learning for Kids
E Learning for Kids: Math: Music / Dance Performance: Data and Chance Experiments
On this interactive site students use the setting of a dance performance to predict all possible outcomes and make vertical and horizontal bar graphs.
Other
Stat Soft: Statistics Glossary
Dozens of statistical terms are defined and illustrated in this glossary.
Other
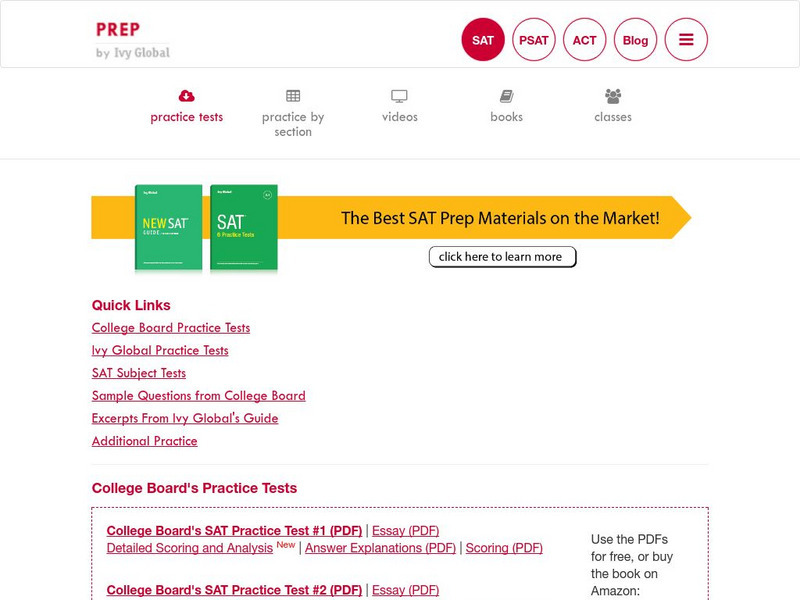
Ivy Global: Sat Practice Tests
Students can access SAT's practice tests here, as well as take some diagnostic tests to find their weak areas and to predict their probably results on the SAT. In addition, this site offers insights into the make-up of the new SAT, and...