Curated OER
Technology Blackout Day
Students describe the impact of modern technology inventions on daily life. They create a graph of the class's favorite item of technology and draw a picture of their favorite piece of modern technology.
Curated OER
Planning for and Surviving Earthquakes
Students work in small groups to explore the FEMA for Kids site. They take the role of FEMA officials. Student list three items they may need to survive an earthquake. They complete a worksheet and discuss their results with the rest of...
Curated OER
Transformation, Reflections, Rotations and Translations
Students create a quilt, using different patterns. For this geometry lesson, students apply prior knowledge as they use different patterns to help them create a quilt using transformations and geometric shapes.
Curated OER
How Does the Loss of Ozone Affect Our Climate
Students explore the greenhouse effect and what it does to the environment. They discuss if and how human behavior contributes to global warming and test natural materials for carbon content.
Curated OER
Count The Letters
Students perform activities involving ratios, proportions and percents. Given a newspaper article, groups of students count the number of letters in a given area. They use calculators and data collected to construct a pie chart and bar...
Curated OER
The Effects Of Earthquakes
Students investigate the concept of how earthquakes occur and the after effects of how they effect landforms. They conduct research it using a variety of resources and measure the varying intensities of how earthquakes effect the...
Curated OER
Using Proportions to Estimate
Students calculate ratio and proportion. In this unit rates lesson plan, students estimate using proportions and find their errors in doing so. They calculate unit rates and define the concept of unit rates.
Curated OER
Using Ratios to Taste the Rainbow
Students solve problems using ratios and proportion. For this algebra lesson, students analyze skittles and their different colors as they apply the properties of ratios and proportions to solve their problems.
Curated OER
The Yo-Yo Problem: Solving Linear Equations
Students compute the length of time it will take to save enough money to purchase a yo-yo. For this math lesson, students create a design with pennies and write the associated linear equation. In this linear equations lesson, students...
Pennsylvania Department of Education
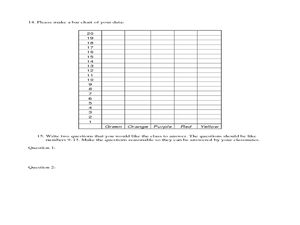
Equal Groups
Students explore statistics by completing a graphing activity. In this data analysis instructional activity, students define a list of mathematical vocabulary terms before unpacking a box of raisins. Students utilize the raisins to plot...
Curated OER
Is the Hudson River Too Salty to Drink?
Students explore reasons for varied salinity in bodies of water. For this geographical inquiry lesson, students use a variety of visual and written information including maps, data tables, and graphs, to form a hypothesis as to why the...
Curated OER
Shape Up!
An outstanding instructional activity on teaching the basic shapes and polygon names to young geometers is here for you. In it, learners investigate the role of basic polygons in the strength of structures. They use geoboards, rubber...
Curated OER
Using Wordless Comics To Help Create Meaning in Reading
Use picture cues as a tool in order to create meaning along with text. With a wordless comic, young illustrators discuss the main idea and character traits, and independently write a summary for a page of a wordless comic. This strategy...
Discovery Education
How's the Weather?
Young meteorologists explore different aspects of the weather while learning about measurement devices. They build instruments and then set up a weather station outside and measure temperature, humidity, air pressure, wind speed, and...
Achieve
Ground Beef
Ever wonder how a butcher creates the different types of ground beef? Young mathematicians explore the methods butchers use to create their desired ground beef quality. Given a combination of two types of meat with varying...
Curated OER
How Big Is a Blue?
Students sort and compare/contrast the lengths of various whales. They sort pictures of whales in order of smallest to largest, and given a rope marked with the lengths of the whales, they compare the actual lengths of the whales.
Curated OER
"Afternoon on the Amazon" by Mary Pope Osborne
Students read and complete activities dealing with the book "Afternoon on the Amazon". They create webs of words used in the book and write about what they have read.
Curated OER
It's All in the Genes
Twelfth graders investigate the inheritance of traits through several hands-on activities that illustrate the transmission of genetic characteristics. Students study advanced topics including multiple alleles, polygenic traits,...
Curated OER
Figuring Elapsed Time
Learners discover the concept of elapsed time. In this calculating time lesson, students utilize the Internet to complete record sheets based on the concept of elapsed time. Finally, the learners answer questions on their own.
Curated OER
How Far Will It Roll?
Students construct a car with the longest roll using a ramp. They construct Lego cars, modify the wheel sizes and car configurations to evaluate which car design rolls the longest distance, develop a graph, and complete a worksheet.
Curated OER
A Fortnight of Furlongs
Students perform a webquest to research information about the horse industry. They look at economic and the cultural impact of the industry on Central Kentucky and then create a group presentation that addresses all essential questions.
Curated OER
Pair 'Em Up!
Third graders verify the validity of Punnett squares. They simulate a real-world situation by drawing chromosomes from a paper bag and track the data.
Curated OER
Misleading Graphs
Students explore number relationships by participating in a data collection activity. In this statistics lesson, students participate in a role-play activitiy in which they own a scrap material storefront that must replenish its...
Curated OER
The Bell Curve
Students explore the concept of the bell curve. In this bell curve lesson, students discuss the controversy associated with the bell curve. Students use an applet to explore a normal distribution. Students discuss mean, median, mode,...


