Curated OER
Wrapped Up In A Kiss!
Students use the wrapper of a Hershey's Kiss to practice estimating, predicting and measuring. They measure with centimeter rulers.
Curated OER
The Stock Market Game
Students explore the stock market. They choose a company and research the company's financial report. Students select 4-10 stocks and become an advocate for one stock. Using spreadsheet software, students compare stocks. They analyze...
Curated OER
"Socrates and the Three Little Pigs" by Mitsumasa Anno
Learners gain an understanding of probability and make reasonable estimations.
Curated OER
Do Different Colors Absorb Heat Better?
Students work together to test how the color of a material affects how much heat it absorbs. They make predictions and take notes on their observations. They discover how engineers use this type of information.
Curated OER
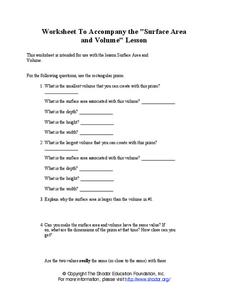
Surface Area and Volume
Accompanying the lesson at www.shodor.org, this worksheet present students with a series of questions about the volume and surface area of a rectangular prism and a triangular prism. Students predict how these values would change if the...
Curated OER
Fire!, Probability, and Chaos
Students explore the concept of probability. In this probability lesson, students simulate a controlled forest burn using an applet. Students vary the probability of trees burning and predict what will happen.
Curated OER
Guided Reading Lesson: Here Comes the Bus
Learners discover basic concepts of print. In this early literacy lesson, students discover basic high frequency words. Learners make predictions as they read. Cross-curricular activities provided.
Curated OER
A Thanksgiving Survey
Students conduct a survey. In this math lesson, students design and conduct a survey about Thanksgiving foods. Students display the collected data in a graph and use the graph to determine what food to serve for a Thanksgiving meal.
Curated OER
Scale Me Down
Students create scale drawings, and ultimately scale models, of real-world objects in this Math lesson about ratios, proportion, scaling factors, and cross products. The lesson includes ideas for cross-curricular extensions and is...
Curated OER
Not Everything is More Expensive
Students explore percent increases and decreases. They calculate the percent increase and decrease. Students use math to solve problems and communicate. They apply the given formula for percent increase/decrease.
Curated OER
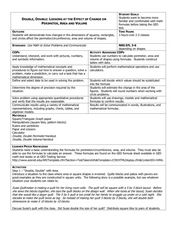
Double, Double: Looking at the Effect of Change on Perimeter, Area and Volume
Young scholars explore perimeter, volume, and area. In this math lesson, students explore how changes in dimensions of geometric shapes affect the perimeter, area and volume of the various shapes. Young scholars investigate the results...
Curated OER
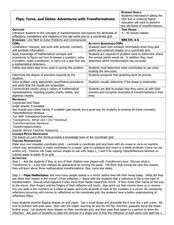
Flips, Turns, and Slides: Adventures with Transformations
Young scholars explore transformations. In this math lesson, students plot points on a coordinate grid and construct shapes. Young scholars discuss movements on the grid as flips, turns and slides.
Curated OER
Party Time
Young scholars explore the cost of a party. For this math lesson, students plan a party and determine the cost of hosting a party. Young scholars use information from grocery stores to determine the unit cost of items for the party.
Curated OER
Counting on Measurement
First graders explore measurement. They measure by counting non-standard units. Students use a variety of non-standard units to predict and measure volume of various containers using rice.
Curated OER
Does Weight Affect Drag?
Students investigate how weight affects a parachute's rate of fall. In this investigative lesson students test parachutes, average results and conclude what makes a faster descent.
Curated OER
Drip, Drip, Drip or The Case of the Leaky Faucet
Students explore the cost of wasted water. In this math lesson, students conduct an experiment in which they collect data on how much water is lost when a faucet leaks. Students figure the cost of the water that was wasted.
Curated OER
Temperature Bar Graph
Learners explore mean, median and mode. For this math lesson, students analyze temperature data and figure the mean, median, and mode of the data. Learners graph the data in a bar graph.
Curated OER
Movement
Students conduct an experiment. For this movement lesson, students see how far a marble will roll after coming down a ramp. The students change the height of the ramp to make it roll faster and record their results.
Curated OER
Box Plots on the TI-83 Calculator
Eighth graders research box plots on the Internet. They gather real life statistics and analyze the collected statistics by making multiple box plots on the TI-83 calculator.
Curated OER
100 Stamps for 100 Days
Students recognize similarities and generalize patterns. In this math and technology lesson plan, students develop an understanding of number patterning by grouping stamps and counting by 10s.
Curated OER
Bar Graph Lesson
Students make a bar graph. In this graphing lesson, students discuss why bar graphs are used and are shown bar graph examples. Students create their own bar graph to compare the heights of different things around the world. Students...
Curated OER
Atmospheric Processes -- Convection
Students work together to discover how temperature changes can affect the density of water and air. They make predictions on what they believe is going to occur. They answer questions to complete the lesson.
Curated OER
Behavior Of Substances At Different Temperatures
Fourth graders are involved in a lab experience to look at the concept of heating up various materials to see how they react to an increase in temperature. They make observations and record them in a lab journal. Then students discuss...
Curated OER
Purchasing A Used Car
Seventh graders investigate the practice of purchasing a used car with the help of links and resources found in the lesson plan. They conduct research to find the right kind of car using a variety of resources. Students examine data in...
Other popular searches
- Math Predictions
- Pumpkin Math Predictions
- Making Math Predictions
- Tsunami Prediction Math
- Mathematical Predictions


