Education Development Center
Choosing Samples
What makes a good sample? Your classes collaborate to answer this question through a task involving areas of rectangles. Given a set of 100 rectangles, they sample a set of five rectangles to estimate the average area of the figures. The...
NASA
What's the Frequency, Roy G. Biv?
While all light travels at the same speed, each color in the visible light spectrum contains a different wavelength and frequency. Scholars determine the relationship between frequency and wavelength as they complete the activity. They...
Missouri Department of Elementary
Community Wellness Fair
Seniors work with teachers, counselors, and administrators to organize a community wellness fair. Committees take on the responsibility for the various tasks (publicity, set up, hospitality room, agency contact, thank you letters, etc.)....
Missouri Department of Elementary
Fatal Accident
While there may not be any ghostbusters in the neighborhood, there are plenty of emergency response agencies ready to give support if something is amiss. To that end, instructors invite a member of an emergency response agency to address...
Curated OER
High Exposure
Students interpret data they receive from the media, discuss possible misinterpretation of data from the media and correctly respond to the misconception quiz question.
Curated OER
Play It
There are a number of activities here that look at representing data in different ways. One activity, has young data analysts conduct a class survey regarding a new radio station, summarize a data set, and use central tendencies to...
Curated OER
Modern Physics, New Phenomena
In this physics worksheet, students examine some of the historical theories of physics through the completion of 11 questions.
Curated OER
Mice Rule!
Pupils explain what biodiversity is and how adaptive features are maintained in a population. In this biodiversity instructional activity students complete a simple activity involving mouse populations.
Albert Shanker Institute
Economic Causes of the March on Washington
Money can't buy happiness, but it can put food on the table and pay the bills. The first of a five-lesson unit teaches pupils about the unemployment rate in 1963 and its relationship with the March on Washington. They learn how to create...
Curated OER
What's Your Average? What Do You Mean? I'm More Than Just Average
Upper grade and middle schoolers collect data, analyze and interpret the data. This three-part lesson should provide learners with a firm understanding about the differences between mean, median, and mode and how to perform the...
Illustrative Mathematics
Accuracy of Carbon 14 Dating I
Here is an activity that is intended to highlight a very important issue about precision in reporting and understanding statements in a realistic scientific context. Discuss different ways of reporting the half life of Carbon 14 using...
Curated OER
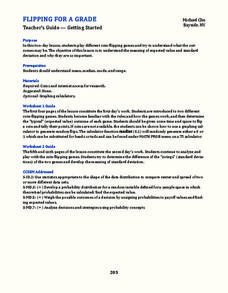
Flipping for a Grade
What happens when your teachers get tired of grading tests and want to use games of chance to determine your grade? How would you decide which game they should play? Learn how to use expected value and standard notation to compare two...
Curated OER
Political Polls
Students explore politcical polling by conducting a poll of student body elections. They prepare a survey, distribute forms, and tabulate data.
Curated OER
Height versus Shoe Size
Students find a correlation between a person's height and his/her shoe size. They have access to entering data into lists on a graphing calculator and can complete scatter plots. Students read and interpret a scatter plot and use the...
Curated OER
How Alike Are We?
Fourth graders find the range, mode, median, and mean for each of the data sets (height and shoe size). They discuss which measure of central tendency for each data set best represents the class and why. Students graph the shoe size and...
Curated OER
Matrices: A Secret Weapon
Students perform operations with matrices. In this algebra lesson plan, students use cryptography and cryptanalysis to solve problems. They add, subtract, and multiply matrices.
Curated OER
Pizza Possibilities
Middle schoolers create and interpret line plots, bar graphs, and circle graphs. The lesson assumes mastery of conversions from fraction to decimal to percent, construction of angles, and at least an introduction to graphs displaying data.
Curated OER
Leaf Weight-Loss Plan
Learners measure the weight of a container of leaves daily to discover how quickly it grows lighter as the foliage dries.
Curated OER
Antacid Tablet Race
Young scholars complete experiments to determine how rocket fuel is affected by surface area and temperature. They compare the reaction rates of antacid tablets. They discuss their results to complete the lesson.
Curated OER
One Size Fits All, Part 1
Can you tell how tall someone is just by looking at their feet? In this activity, young mathematicians measure their height, arm span, and foot size, graph their findings, and answer questions about how these measurements are related....
Curated OER
Box Plots
Young statisticians are introduced to box plots and quartiles. They use an activity and discussion with supplemental exercises to help them explore how data can be graphically represented.
Curated OER
Graphing My Path to Success
Seventh graders examine their school performance through self-assessment of strengths and weaknesses. They construct a line graph, plotting all courses and achievements. Students use graph paper and colored pencils for each activity. If...
Curated OER
Fatal Accident
Eleventh graders explore, examine and study the impact of personal decisions on the safety and health of self and others. They assess how to evaluate individual coping skills to manage life-changing events. Each student defines and...
Curated OER
Maps and Modes, Finding a Mean Home on the Range
Fifth graders investigate data from maps to solve problems. In this data lesson, 5th graders study maps and collect data from each map. Students present their data in a variety of ways and calculate the mode, mean, median, and range.


