Oswego City School District
Regents Exam Prep Center: Mutually Exclusive & Independent Events
The somewhat tricky differences between mutually exclusive, non-mutually exclusive, independent, and dependent events are defined here. Common items such as coins, colored cubes, and a deck of cards are all part of the easy-to-understand...
University of St. Andrews (UK)
University of St. Andrews: History of Mathematics: Abraham De Moivre
This site contains biographical information and works of the mathematician Abraham DeMoivre.
University of St. Andrews (UK)
University of St. Andrews: Ludwig Boltzmann (1844 1906)
A very in-depth biography of this wonderful individual who had numerous successes, Maxwell-Boltzmann Distribution Curves included.
Other
Correlation Coefficients
This page provides a good discussion of correlation coefficients (r,) which indicate the "strength of the linear association between variables." Includes formulas and scatter plots. Some prior knowledge of statistics might be helpful.
Mangahigh
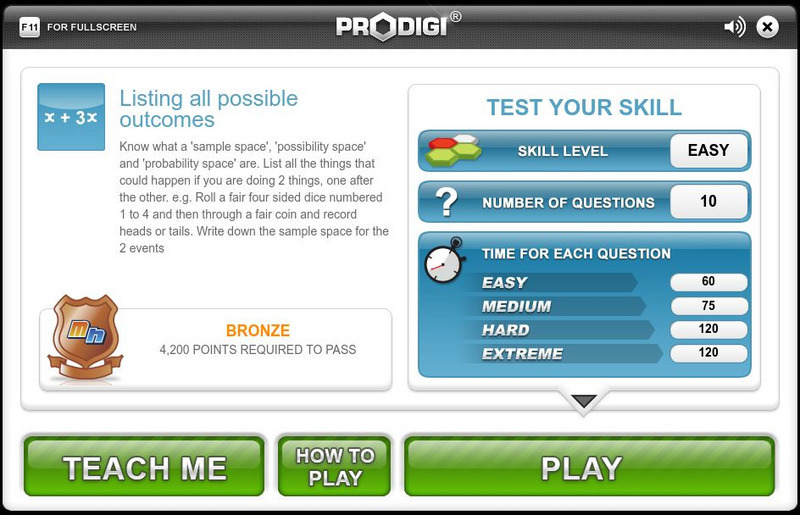
Mangahigh: Data: Listing All Possible Outcomes
Students learn about the concept of possible outcomes by exploring a tutorial. They can then test their knowledge by taking a ten question assessment that increases in difficulty as they correctly answer questions.
Khan Academy
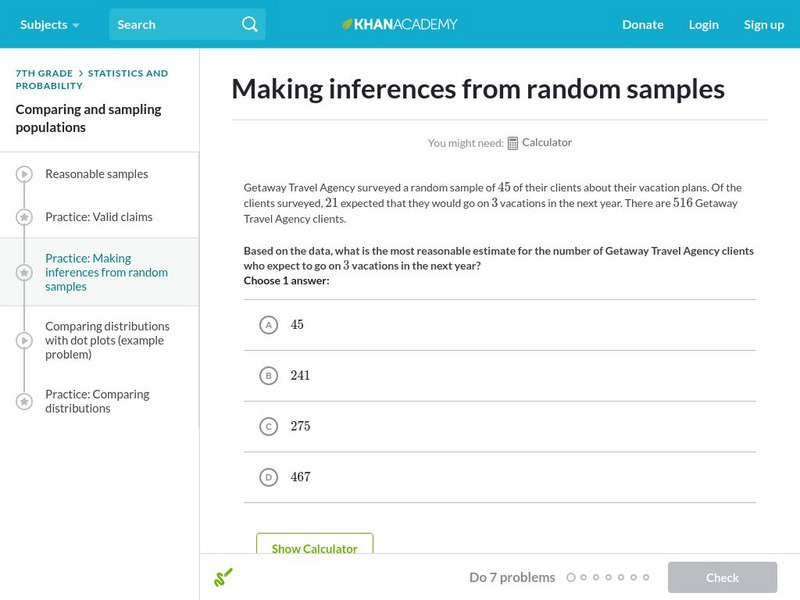
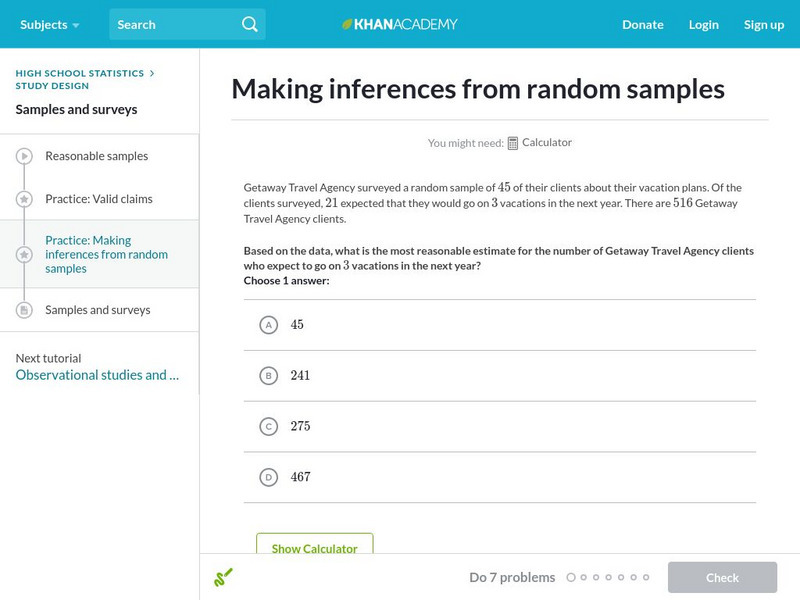
Khan Academy: Making Inferences From Random Samples
Practice making inferences from random samples.
Wolfram Research
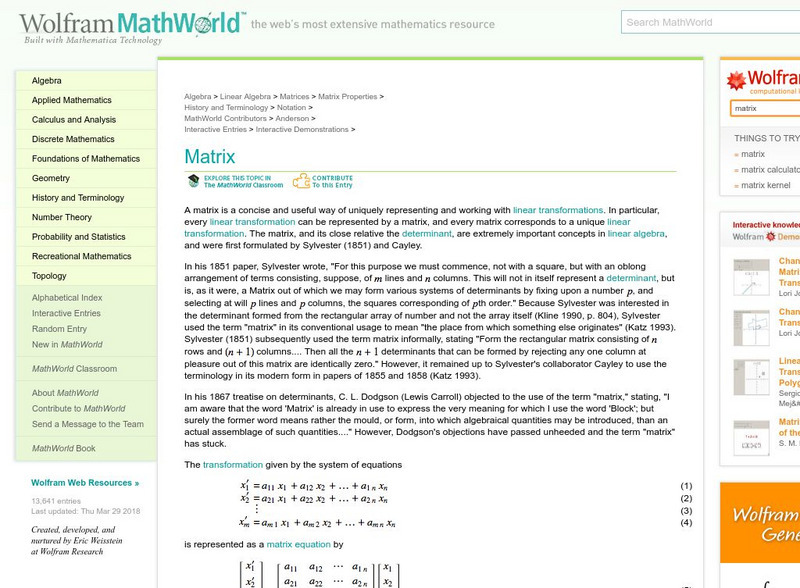
Wolfram Math World: Matrix
From Mathworld.com as site on Maxtricies. Includes formulas, definitions, and links to related articles.
Texas Instruments
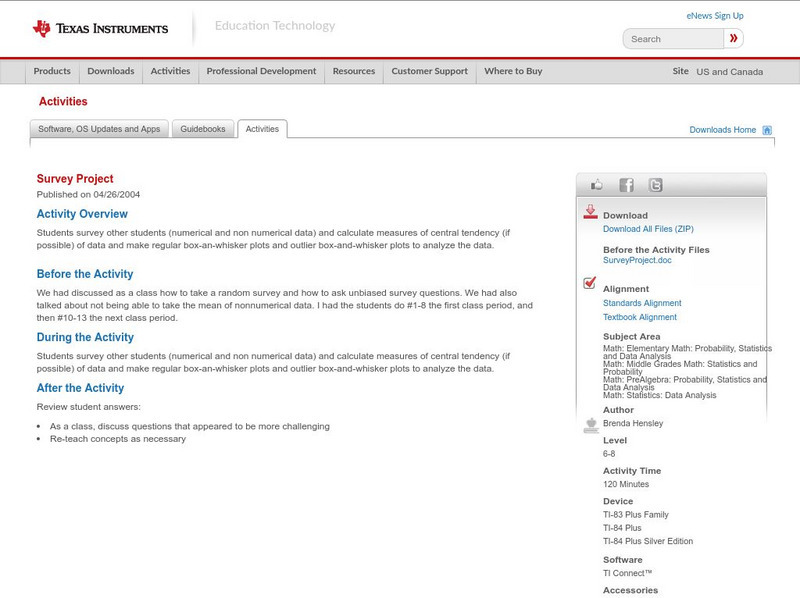
Texas Instruments: Survey Project
Students survey other students (numerical and non numerical data) and calculate measures of central tendency (if possible) of data and make regular box-an-whisker plots and outlier box-and-whisker plots to analyze the data.
Beacon Learning Center
Beacon Learning Center: Leap Frog Experiment
Students design an experiment, collect information using tree diagrams, and interpret the results using charts in this interactive web lesson.
Duke University
Connected Curriculum Project: Matrix Operations: Part 3: Special Matrices
This site explores the properties of several different types of matrices.
Richland Community College
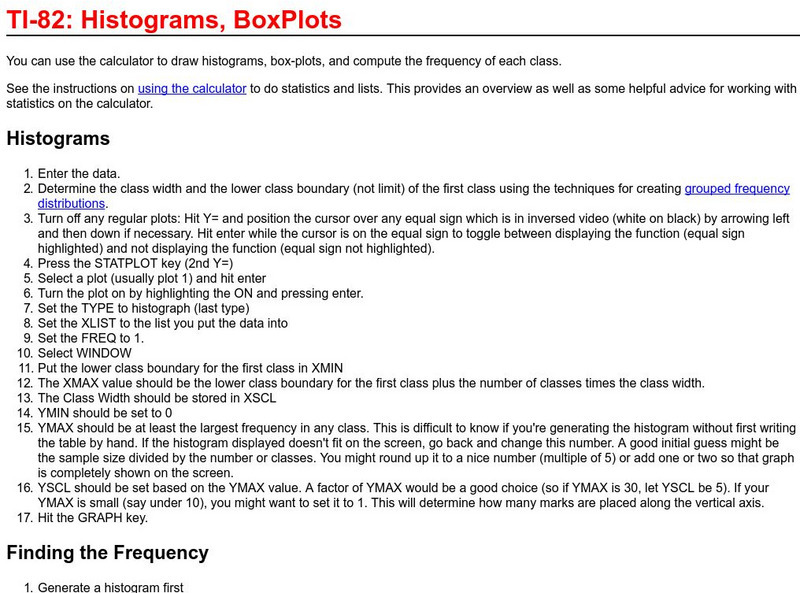
Richland College: Ti 82 Histograms / Box Plots
Richland College provides a step-by-step procedure on how to use a TI-82 to construct histograms and box plots and then use this to find frequency distribution.
Other
Eduteka: Matematica Interactiva
Topics covered in this site are: concepts of numbers, geometry, algebra and statistics. This site has lesson plans, interactive activities and discussions.
Khan Academy
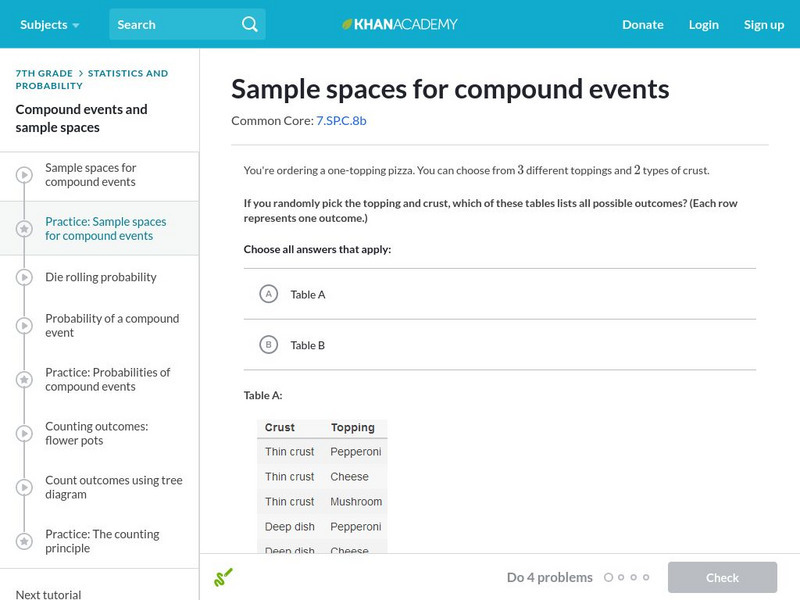
Khan Academy: Sample Spaces for Compound Events
Practice checking if sample space diagrams match a compound event. Students receive immediate feedback and have the opportunity to try questions repeatedly, watch a video or receive hints.
Khan Academy
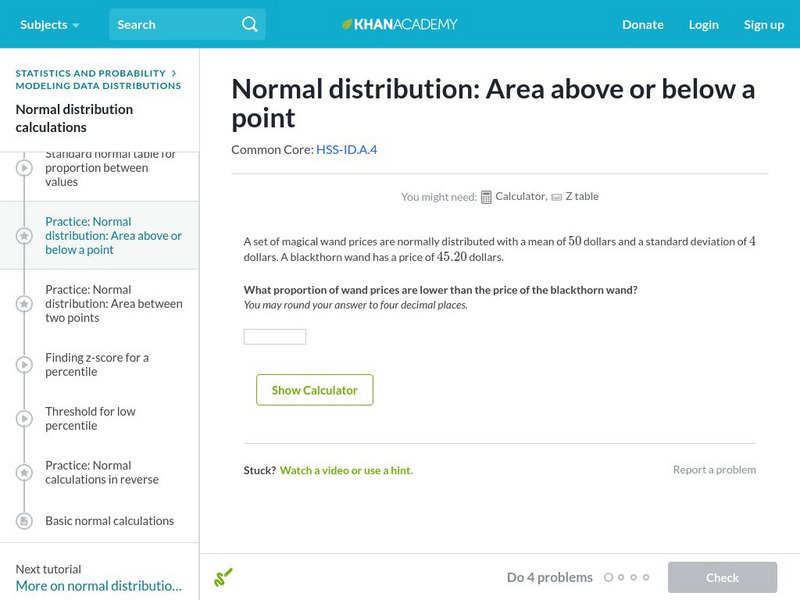
Khan Academy: Normal Distribution: Area Above or Below a Point
Use a z-table to find the probability of a particular measurement. Students receive immediate feedback and have the opportunity to try questions repeatedly, watch a video or receive hints.
CK-12 Foundation
Ck 12: Mutually Inclusive and Mutually Exclusive Events
[Free Registration/Login may be required to access all resource tools.] Learn about mutually inclusive and exclusive events in probability.
Khan Academy
Khan Academy: Normal Distributions Review
Normal distributions come up time and time again in statistics. A normal distribution has some interesting properties: it has a bell shape, the mean and median are equal, and 68% of the data falls within 1 standard deviation.
Khan Academy
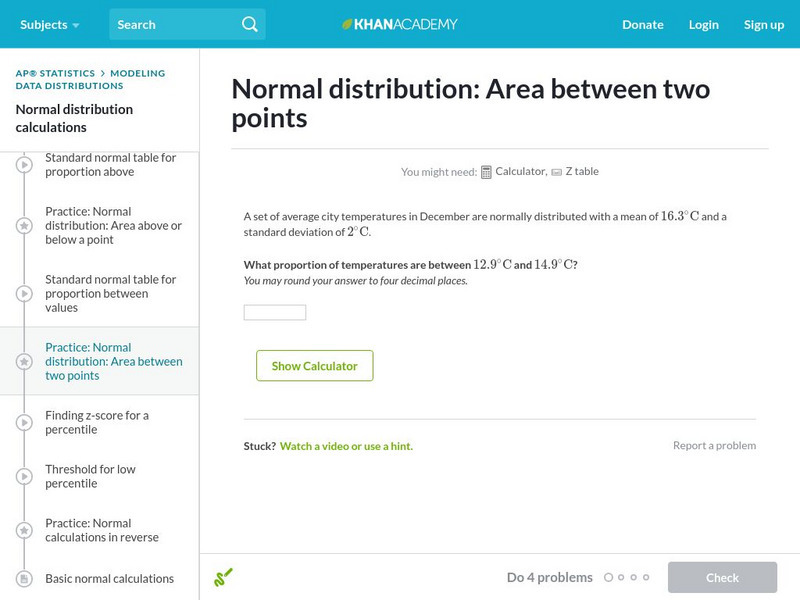
Khan Academy: Normal Distribution: Area Between Two Points
Use a z-table to find the probability that a particular measurement is in a range. Students receive immediate feedback and have the opportunity to try questions repeatedly, watch a video or receive hints.
Other
Utah St. Univ.: Coin Tossing Applet
An interesting Applet that simulates the toss of a coin 100 times. A quick count of the results and an accompanying graph make this site useful for both teacher and student.
Other
Northern Michigan University: Stem and Leaf Plot
Site discusses how to use stem-and-leaf plots with an example and the steps listed for easy reading.
National Council of Teachers of Mathematics
Nctm: Figure This: Math Challenges for Families
Students, teachers, and parents alike will enjoy this challenging math site. It contains a clever brain teaser section plus creative problems related to algebra, geometry, measurement, numbers, statistics, and probability. A Spanish...
Annenberg Foundation
Annenberg Learner: Cast Your Vote!
Cast your vote and answer some questions on the accuracy, usefulness, and impact of polls. Then read about what role polls play in an election.
Khan Academy
Khan Academy: Samples and Surveys
When we collect data it's important to know what type of data we're collecting and how to collect it properly.
Khan Academy
Khan Academy: Transforming Data Problem
It is very common to take data and apply the same transformation to every data point in the set. For example, we may take a set of temperatures taken in degrees fahrenheit and convert them all to degrees celsius. How would this...
Khan Academy
Khan Academy: Making Inferences From Random Samples
Given a random sample, practice figuring out what can we reasonably infer about the entire population? Students receive immediate feedback and have the opportunity to try questions repeatedly, watch a video or receive hints.


