Curated OER
Math in Society
Twelfth graders determine probabilities of real-life events such as life expectancies, winning a lottery ticket and the break-even premium. They apply how life-expectation tables are used to estimate the probability that an individual...
Curated OER
The Jelly Bean Problem
In this probability worksheet, students solve 1 word problem about the probability of drawing a particular color jelly bean out of a bag. Students are given two bags with 4 jelly beans each.
Curated OER
What are My Chances?
Students calculate the chance of an event occurring. In this statistics activity, students use combination and permutation to calculate the probability of an event occurring. They differentiate between theoretical and experimental...
Curated OER
EMS Lesson 2: Outrageous Offspring
Students investigate the principles of probability that can be used to predict hereditary traits.
Curated OER
Combinations and Permutations
Fifth graders investigate the concepts of combinations and permutations using probability. They practice calculations using probability to measure the outcomes. Students demonstrate how to organize and categorize the data.
Curated OER
Normal Curve Areas
In this normal curve areas learning exercise, students follow 6 steps to compute probability regarding possible sample means using a large sample. First, they label the scale with the mean and corresponding standard deviations. Then,...
Curated OER
Normal Curve Areas - Population
In this normal curve areas learning exercise, students follow 6 steps to compute the probability regarding the values from the population. First, they label x-scale with the mean and corresponding standard deviations and shade the...
Curated OER
Normal Curve Areas
In this normal curve areas worksheet, students follow 6 steps to compute the probability regarding the possible sample of proportions using a large sample population. First, they label the Ps-scale with the proportion and corresponding...
Curated OER
What's in the Bag?
Students calculate the probability of an event occurring. In this statistics instructional activity, students calculate the outcome using combination and permutation. They differentiate between-theoretical and experimental probability.
Curated OER
Spinner Experiment
Students collect and analyze data, then draw conclusions from the data and apply basic concepts of probability.
Curated OER
Listing Outcomes
In this probability worksheet, students learn how to make a tree diagram to determine the possible outcomes in a probability situation. They then answer 4 probability questions.
Curated OER
Problem Solving Application: Use Data to Make Predictions: Problem Solving
In this making predictions worksheet, students use the understand, plan, solve, and look back method to help them solve the questions about probability. Students use the data within the problem to predict and solve.
Curated OER
Poisson Distribution
For this Poisson distribution worksheet, high schoolers solve 4 short answer questions. Students determine the probability of a bank receiving a bad check.
Curated OER
High Five Board Game
For this high five board game worksheet, 8th graders use the game board and instructions provided to create ordered pairs using dice and cubes, then analyze the probability and predict outcomes.
Curated OER
What's Math Got To Do With It?
Students explore numbers, computation, ratios, proportions, probabilities, statistics, and money in this six lessons unit. Practical applications in the real world are emphasized through an interactive approach to math in these lessons.
Curated OER
Location, Location, Location!
Students determine the probability of drawing coins from each of the three United States Mints. They measure the distance between the Mints and determine which is closest to them. They convert fractions to percentages.
Curated OER
Tree Diagrams
In this tree diagrams worksheet, learners solve and complete 10 different problems that include creating tree diagrams. First, they toss a coin and roll a die simultaneously to determine the outcomes with a tree diagram. Then, students...
Curated OER
Algebra/Geometry Institute 2007
Fifth graders practice calculating probability using statistics. In this math statistics lesson, 5th graders discover the meanings of the terms unlikely, likely, eventually, and chance, when asked to answer questions about the...
Curated OER
Corrupted Politicians
High schoolers solve problems using statistics and probability. In this math lesson, students analyze how many corrupted members there are in a fictional town council. They give real life examples where statistics and probability can be...
Curated OER
Combinations
In this combinations worksheet, students examine, analyze and calculate several ways to solve probability word problems involving combining ingredients to make a cake.
Curated OER
Randomness and Information Worksheet
In this randomness worksheet, students calculate the probability of certain things happening by completing 4 different word problems.
Curated OER
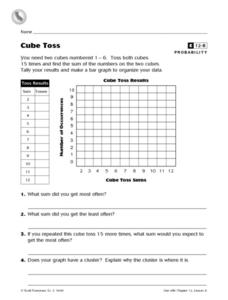
Cube Toss
In this probability and graphing worksheet, learners solve 8 problems in which data from a cube toss is displayed on a table and graph. Students answer the questions about their results.
Curated OER
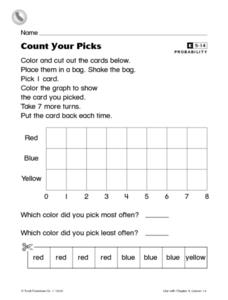
Count Your Picks
In this probability worksheet, students cut out 3 color cards and place them in a bag. Students pick a card out of the bag 8 times, putting the card back each time. Students record their results on a bar graph.
Curated OER
SAT Grid Practice Test 07
In this practice test worksheet, students solve percent problems, find the probability of given events, determine the median, and find the unit price. This one page worksheet contains ten multi-step problems.
Other popular searches
- Experimental Probability
- Probability Games With Dice
- Probability Games
- Theoretical Probability
- Probability Sample Space
- Math Probability
- Compound Probability
- Probability and Statistics
- Genetics Probability
- Conditional Probability
- Probability Lesson Plans
- Simple Probability


