Curated OER
Graphs and Functions
Use this series of activities to introduce learners to graphing functions. They graph both linear and quadratic equations by hand and with a Graph Sketcher Tool. Several imbedded links and handouts are included in the lesson.
Curated OER
One Size Fits All, Part 1
Can you tell how tall someone is just by looking at their feet? In this activity, young mathematicians measure their height, arm span, and foot size, graph their findings, and answer questions about how these measurements are related....
Curated OER
Finding Equations
Students make equations from everyday data. They create a graph from the equations. Students predict and analyze the results. Students complete the second scenario on their own and turn in their handout.
Alabama Learning Exchange
Systems on a Mission
Solve systems of equation problems using four different methods: elimination by addition or subtraction, graphing, elimination by multiplication, and substitution. Middle schoolers are then given a series of "missions" to complete.
Curated OER
Scattered About
Students are introduced to the concept of scatter plots after reviewing the various types of graphs. In groups, they analyze the type of information one can receive from a scatter plot and identify the relationship between the x and y...
Curated OER
Children's Museum of Houston - Pre/Post Classroom Activities - Nets
Young scholars make three dimensional shapes with nets. In this nets lesson, students receive nets which they fold to make a three dimensional object. They predict what shape each net will make and verify it after making the net. They...
Curated OER
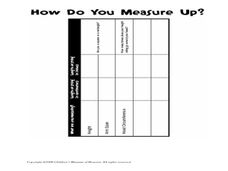
How Do You Measure Up?
Students measure their body. In this measurement lesson, students use a string to measure their height and the circumference of their head. They record this information on the worksheet provided and answer questions as a group.
Curated OER
Box Plots
Young statisticians are introduced to box plots and quartiles. They use an activity and discussion with supplemental exercises to help them explore how data can be graphically represented.
Curated OER
Will the Leaning Tower Fall?
Young scholars research the Tower of Pisa and write a report about its history. They examine the physics of why it leans and whether it might fall. Students plan a trip to Italy to view the Tower. They develop an itinerary and budget for...
Curated OER
Ashes to Ashes: Using Evaporation Rate to Identify an Unknown Liquid
Learners explore the concept of evaporation rates in this evaporation rates lesson. They will try to identify the chemical that began a fire, perform an experiment where they use the evaporation rates to determine the unknown liquid, and...
Curated OER
Traveling Through the Solar System
Students use calculator and non-calculator methods for analyzing data. They apply data collection and analysis in a study of mass and weight. Students enhance and apply the concept of line of best fit. They master graphing in a plane,...
Curated OER
Quadrilaterals
In this geometry worksheet, 10th graders solve problems with quadrilaterals. They calculate the sum of the angles, find missing angles and identify properties of quadrilaterals. There are 16 questions with an answer key.
Curated OER
Meet the Neighbors: Planets Around Nearby Stars
Students explain why a transiting planet causes a periodic dimming in the light from its parent star. They determine the radius of a planet, and its orbital distance, by analyzing data and manipulating equations. Students compare the...
Alabama Learning Exchange
Technology for Displaying Trigonometric Graph Behavior: Sine and Cosine
Students explore the concept of sine and cosine. In this sine and cosine lesson, students work in groups to graph sine and cosine functions. Students examine how coefficients in various parts of each parent function shift the...
Curated OER
Teaching with Collections
Students examine collections. In these real-world collections lessons, students examine and describe buttons and shells. Students will then sort, classify, and graph items according to various indicated descriptors.
Curated OER
Arithmetic: Fractions
In this fractions instructional activity, students add positive and negative fractions with unlike denominators. They compute a fractional part of a number. This six-page instructional activity contains approximately 20 problems....
Curated OER
Relative Ratios
Middle schoolers discover that proportions are made up of equal ratios each containing the same building blocks. They, using the Internet, apply their knowledge of direct relationships and proportions to problems in planetary science.
Curated OER
Inequalities and Triangles
Students prove and apply theorems of triangle inequality and hinge theorem. For this geometry lesson, students will discuss which triangle is bigger and why. They will use theorems, such as Exterior Angle Inequality or the Pythagorean...
Curated OER
Using Proportions to Estimate
Students calculate ratio and proportion. In this unit rates lesson, students estimate using proportions and find their errors in doing so. They calculate unit rates and define the concept of unit rates.
Curated OER
Under the Sea - Ocean Mammals/Fish
Learners explore the similarities and differences between ocean mammals and fish. The characteristics of the life forms observed are placed onto a graph. The classroom becomes the botom of the sea and is explored to gain the required data.
Curated OER
Picking Pythagoras
Students discover that side measurement is used in determining angle classification of a triangle. By squaring sides, they predict whether triangles be right, obtuse, or acute. They prove the Pythagorean Theorem and use it to solve...
Curated OER
Graphing at all Levels: It's a Beautiful Thing!
Mixing math and art is done in this lesson by applying graphing knowledge to create a unique piece of art. This lesson varies acording to the graphing knowledge of the artist. First, learners identify and review various types of graphing...
Curated OER
Recognize, create and Record Simple Repeating Patterns
Students analyze, create, and record repeating patterns. For this geometry lesson, students create shapes using patterns and keep track of the different shapes. They incorporate transformation and reflections into their patterns.
Curated OER
Make a Pass at Me
Learners identify different types of functions and units of measurements. In this statistics lesson plan, students will collect data, graph their data and make predictions about their data. They plot a linear regression graph.


