Pennsylvania Department of Education
Adding and Subtracting Rational Numbers to Solve Problems
Young scholars explore the concept of probability. In this probability lesson plan, students use area to determine probability. Young scholars use charts and spinners to help determine the probability of events such as...
Curated OER
Probability: Ratios and Percents
Students investigate ratios and percents. In this algebra lesson, students explore the probability of an event occurring. They convert between ratios and percents as they solve the odds.
Curated OER
Basic Matrix Algebra
Students perform basic matrices operations. In this algebra lesson, students add, subtract, multiply and divide matrices. They solve system of equations using matrices.
Curated OER
Introductory Algebra Chapter 10 Review
In this math worksheet, students solve the problems for the quadratic equations. They factor the equations and determine the probability of the two solutions.
Curated OER
Data Analysis & Probability
Learners make predictions based on survey results. They calcuate sample proportions. Students estimate the number of voters in their district preferring the democratic candidate using their sample results. They review sample proportions...
Virginia Department of Education
Mathematics Vocabulary Cards – Grade 4
An excellent way to reinforce math vocabulary in your classroom! Seventy-eight posters focus on number and number sense, computation and estimation, measurement, geometry, probability and statistics, and patterns, functions, and algebra.
5280 Math
Interesting Times
Gain a little interest in functions with a real-life task. Young scholars analyze home loan data with a geometric sequence and series. They use the models to make predictions about the total loan payments at certain intervals in a...
Curated OER
Time-Axis Fallacy and Bayes Theorem
Students determine that knowledge of an event's outcome can affect the probability of the unknown outcome of an event that has already occurred.
Curated OER
Unit 1, Worksheet 3, Note Taking in Mathematics
In this taking notes worksheet, learners write notes on specified topics such as combining like terms, identifying number patterns, basic mathematical operations of integers, and the guess and check strategy. This two-page worksheet...
Curated OER
Solving a Legend- Exponents, Recursive and Explicit Equations.
Eighth graders play a game to solve problems. For this exponents and scientific notations lesson, 8th graders play a game in small groups to move colored disks from location A to location C. Students identify recursive patterns to solve...
Curated OER
What Are The Chances
Students calculate the probability of an event occurring. In this probability lesson, students differentiate between independent, dependent or compound events. They find the range of the data.
Curated OER
Probability Review
Students engage in a lesson that is concerned with the concepts related to probability. They review the key properties of statistics involved in the measurement of probability that includes mean, median, and mode. The lesson includes...
EngageNY
Ruling Out Chance (part 1)
What are the chances? Teach your classes to answer this question using mathematics. The first part of a three-day lesson on determining significance differences in experimental data prompts learners to analyze the data by...
EngageNY
Experiments and the Role of Random Assignment
Time to experiment with mathematics! Learners study experimental design and how randomization applies. They emphasize the difference between random selection and random assignment and how both are important to the validation of the...
EngageNY
Differences Due to Random Assignment Alone
It takes a lot of planning to achieve a random result! Learners compare results of random assignment, and conclude that random assignment allows results to be attributed to chance. They also realize the set of random means...
EngageNY
Drawing a Conclusion from an Experiment (part 1)
Challenge your classes to complete an experiment from beginning to end. Learners make their own hypotheses, collect and analyze their own data, and make their own conclusions. They are on their way to becoming statisticians!
Inside Mathematics
Conference Tables
Pupils analyze a pattern of conference tables to determine the number of tables needed and the number of people that can be seated for a given size. Individuals develop general formulas for the two growing number patterns and...
EngageNY
Sampling Variability in the Sample Proportion (part 1)
Increase your sample and increase your accuracy! Scholars complete an activity that compares sample size to variability in results. Learners realize that the greater the sample size, the smaller the range in the distribution of sample...
EngageNY
Types of Statistical Studies
All data is not created equal. Scholars examine the different types of studies and learn about the importance of randomization. They explore the meaning of causation and when it can be applied to data.
Inside Mathematics
Snakes
Get a line on the snakes. The assessment task requires the class to determine the species of unknown snakes based upon collected data. Individuals analyze two scatter plots and determine the most likely species for five...
Curated OER
Using Graphs
Print and use this useful unit on basic algebraic functions, domain, range, and graphing. Tasks include, illustrating simple functions with a graph, and identifying the domain and range of the function. This twelve-page packet contains...
Curated OER
Mathematical Modeling
Study various types of mathematical models in this math lesson. Learners calculate the slope to determine the risk in a situation described. They respond to a number of questions and analyze their statistical data. Then, they determine...
Virginia Department of Education
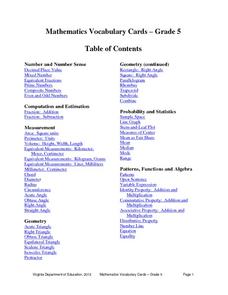
Mathematics Vocabulary Cards - Grade 5
Elevate your fifth graders' understanding of math concepts with a series of vocabulary posters. Featuring terms concerning probability and statistics, measurement, algebra, and decimal place value (and many more), the posters are...
Inside Mathematics
Archery
Put the better archer in a box. The performance task has pupils compare the performance of two archers using box-and-whisker plots. The resource includes sample responses that are useful in comparing individuals' work to others.


