Curated OER
Exponential Growth Versus Linear Growth I
Your algebra learners will discover how quickly an exponential function value grows compared to a linear function's value. Making a table of values helps in this comparison, set in the context of making a wage for raking leaves.
Mathematics Vision Project
Geometric Figures
Logical thinking is at the forefront of this jam-packed lesson, with young mathematicians not only investigating geometric concepts but also how they "know what they know". Through each activity and worksheet, learners wrestle with...
Charleston School District
Solving Systems with Substitutions
How many large and small watermelons did he sell? Just use the given information to write and solve a system of equations! The two videos accompanying the lesson explain the substitution method and then introduce problem solving. The...
Curated OER
Stars and Slopes
More of a math lesson than physics or space science, high schoolers take a set of data and plot it on a log-log coordinate system. The write-up for day two was never completed, but day one, "Stars and Slopes," is complex and cohesive....
Radford University
A Change in the Weather
Explore the power of mathematics through this two-week statistics unit. Pupils learn about several climate-related issues and complete surveys that communicate their perceptions. They graph both univariate and bivariate data and use...
Education Institute
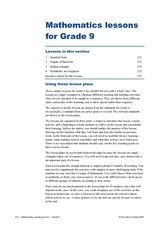
Four Mathematics Lessons for Grade 9
These four lesson plans build algebra skills for working with numbers in exponential form and for examining triangles. Be aware that in the text, scientific notation is referred to as index notation and the laws of exponents as the laws...
Curated OER
Special Products
Looking for a worksheet on special products of binomials? This one-page document includes two separate assignments on special products. Problems include multiplying binomials in the form (a+b)^2,(a-b)^2,(a + b)(a -b), as well as a few...
Curated OER
Sum of an Arithmetic Series
In this algebra learning exercise, students are asked to add up the integers from 1 to 100. They use Gauss method to find the sum of this arithmetic series. There is an answer key with this problem.
Math Stars
Math Stars: a Problem-Solving Newsletter Grade 8
You've just hit the jackpot of integrating math problems and riddles with this jumbo-sized resource! Written as a newsletter, scroll through 35 pages of puzzles and quality problems to engage and encourage your learners to inquire...
Shodor Education Foundation
Graphing and the Coordinate Plane
Ready to introduce your class to the coordinate plane? This website includes a detailed lesson plan that includes two interactive games to help learners practice graphing ordered pairs. The scripted discussion is a little cheesy and a...
Curated OER
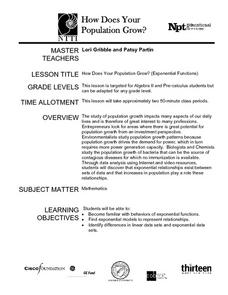
How Does Your Population Grown?
Do you know how the population has grown of your community? Can you predict the population over the next half century? Can we find an algebraic model that matches our data? These along with many more questions can be researched by...
Curated OER
How Alike Are We?
Fourth graders find the range, mode, median, and mean for each of the data sets (height and shoe size). They discuss which measure of central tendency for each data set best represents the class and why. Students graph the shoe size and...
Curated OER
Measurement
Students create two prisms out of the same paper. They calcuate the number of centimeter cubes needed to fill each prism. They discover the concept of volume.
Curated OER
Section 15-9: Permutations
In this permutations worksheet, students solve 16 multiple choice and short answer questions. Students find factorials and permutations of letters and numbers.
Curated OER
Optimization For Breakfast
Students identify he proportion of a cereal box. In this algebra lesson, students define the relationship between patterns, functions and relations. They model their understanding using the cereal box.
Curriculum Corner
7th Grade Math Common Core Checklist
With so many math standards to fit into a school year, it can be difficult keeping track of what you have and have not covered. This collection of Common Core checklists allows you to maintain a running record of when each...
Curriculum Corner
7th Grade Math "I Can" Statement Posters
Translate the Common Core math standards into a series of achievable "I can" statements with this collection of classroom displays. Offering posters for each standard, this resource is a great way to support your seventh graders as...
Curriculum Corner
8th Grade Math Common Core Checklist
Ensure your eighth graders get the most out of their math education with this series of Common Core checklists. Rewriting each standard as an "I can" statement, this resource helps teachers keep a record of when each standard was...
Shodor Education Foundation
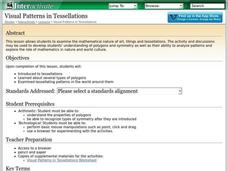
Visual Patterns in Tessellations
Geometers explore the concept of tessellations. They use a tessellation applet to manipulate shapes and design their own tessellation using the applet.
EngageNY
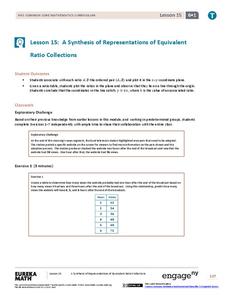
A Synthesis of Representations of Equivalent Ratio Collections
Make all the ratio representations fit together. The 15th segment in a series of 29 presents ratio problems to solve. Scholars use a variety of representations to respond to the questions. The problem set has pupils show how the...
Curated OER
Designing Models to Simulate Actual Events Using a Table of Random Digits
Pupils design models to simulate actual events using a tale of random digits. They estimate the likelihood of a particular outcome using results of simulation. Students investigate the uses of statistical methods to analyze data.
Curated OER
M&M Exponential Activity
Students create a scatter plot of their experimental data. In this algebra lesson, students use M&M's to determine an algebraic model. They discuss results in class.
Curated OER
Digit Cells
In this algebra worksheet, students rewrite a word problem using algebraic symbols to find the digit in the first cell and tell how many zeros are in the entire digit number. There is an answer key.
Center of Excellence for Science and Mathematics Education
A Sick Astronaut
Aspiring astronauts graph, interpret, and analyze data. They investigate the relationship between two variables in a problem situation. Using both graphic and symbolic representations they will grasp the concept of line of best fit to...


